
Trade Anatomy - Short Vol in SPY
Post Mortem Signal Du Jour 20260204
Two weeks ago, we presented an opportunity in the US equity volatility space. The AI narrative had returned in full force, punishing the tech sector as investors debated whether these companies were overspending on AI or were about to be disrupted by it. Which one is it in the end? The jury is still out, and the market’s hesitation remains palpable: no sign of black or white smoke for the moment.
That environment was characterized by rising volatility of volatility a regime where one must remain acutely aware that implied volatility can spike significantly even after an entry point. As noted in last Sunday’s update, we are still deep within this regime. Until this fever breaks, monitoring Vega risk is non-negotiable.
However, high Vol of Vol comes with distinct advantages: if volatility can spike rapidly, it can collapse just as fast. That is precisely what occurred in this trade. In a matter of days, we managed to capture the expected premium as the volatility expansion mean-reverted to normal levels.
We cannot stress this enough: this outcome is not guaranteed. In contrast to tranquil “positive VRP” regimes, where you might collect 4 points with low realized volatility, this environment demands selectivity on entry points and potentially laddering into positions. Will we be blessed with a calmer summer? Time will tell. In the meantime, let’s dissect what became a textbook short volatility trade.
The trade
In our Signal du Jour from two weeks ago, we highlighted an opportunity to short implied volatility in SPY using the 650/715 strangle for the March 13th expiration. The Variance Risk Premium (VRP) in US equities has been abundant since April 2025, making extraction significantly simpler than the grind of 2024.
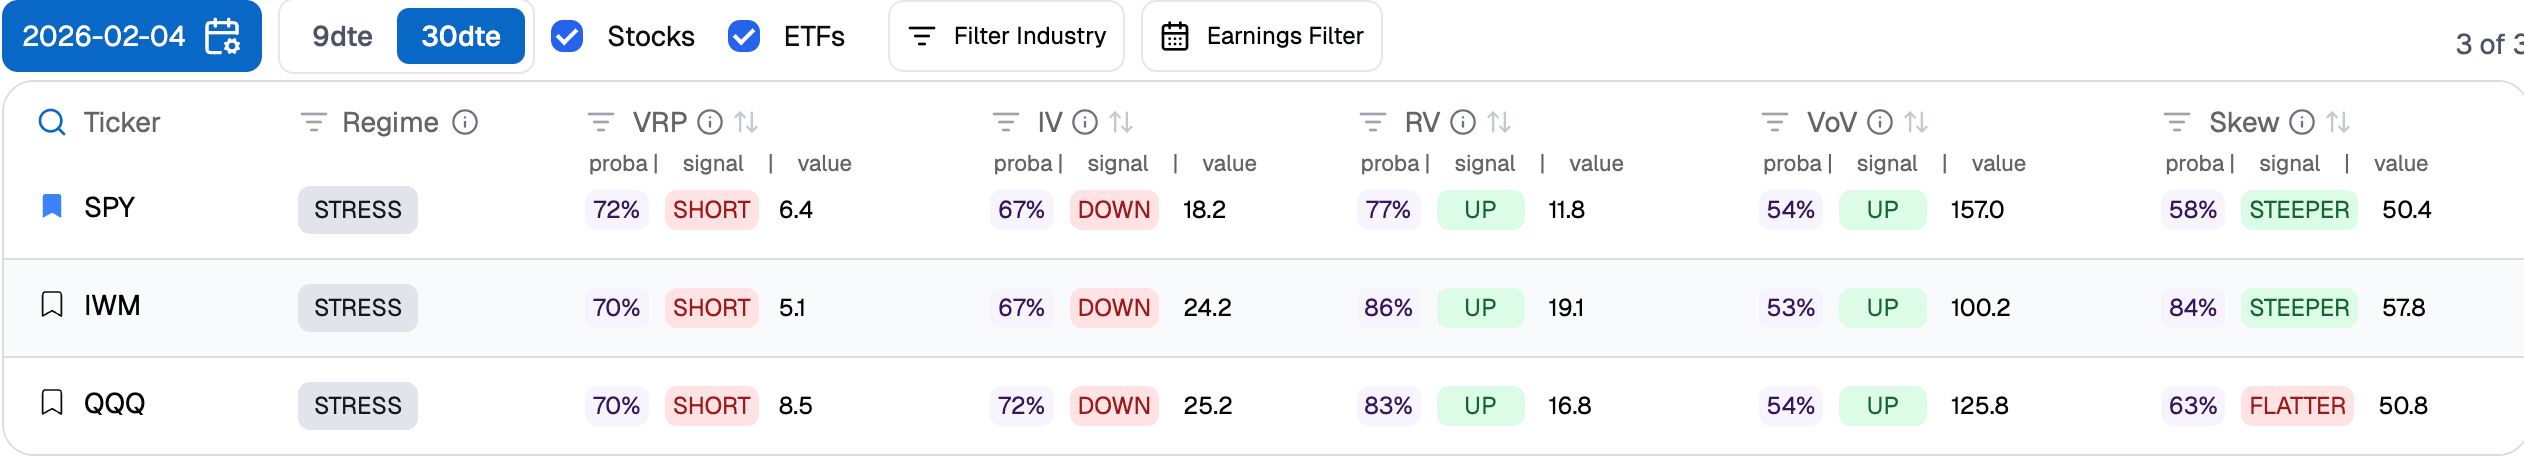
Our models indicated a 72% probability that the implied volatility sold would exceed the subsequent realized volatility. With a VRP of roughly 6.5 points, it typically takes a severe market storm to lose money on such a setup. We also held a directional view on volatility itself: we believed implied volatility was poised to decline from the 18.2% level seen at the close on Wednesday the 4th, even if realized volatility continued to climb.
Unlike our previous trade, where we lucked into a profit despite being on the wrong side of the prediction, this trade played out exactly according to the script:
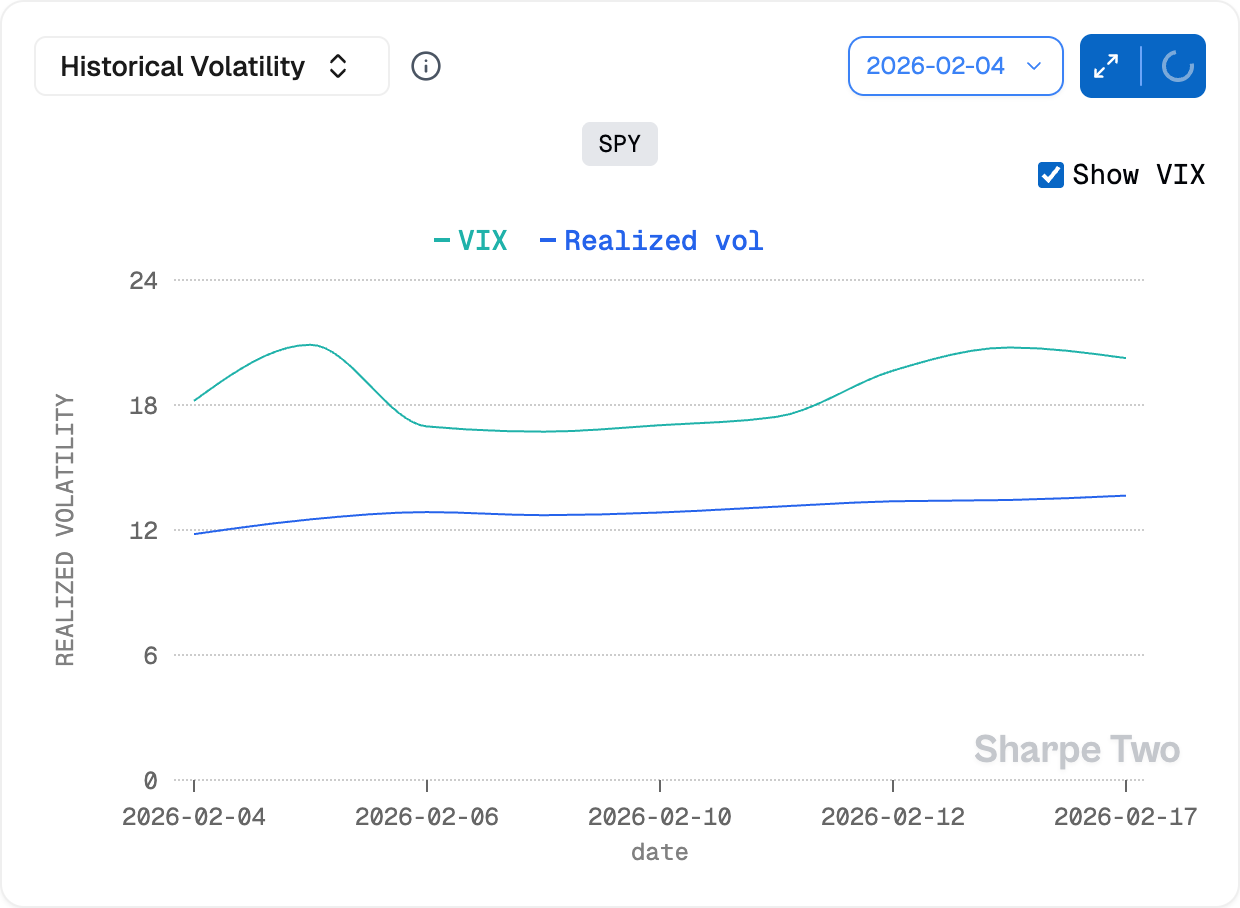
While volatility spiked on Thursday, offering an even better entry than our initial signal, it was crushed on Friday and remained suppressed through the early part of the following week. Meanwhile, realized volatility did rise, but gradually, finishing at 13.65. This was a meaningful increase, but nowhere near enough to challenge the implied volatility we sold. Consequently, even those who entered at Wednesday’s lower prices saw the position turn profitable rapidly.
In scenarios like this, delta can often be detrimental if the underlying asset trends strongly and challenges a strike.
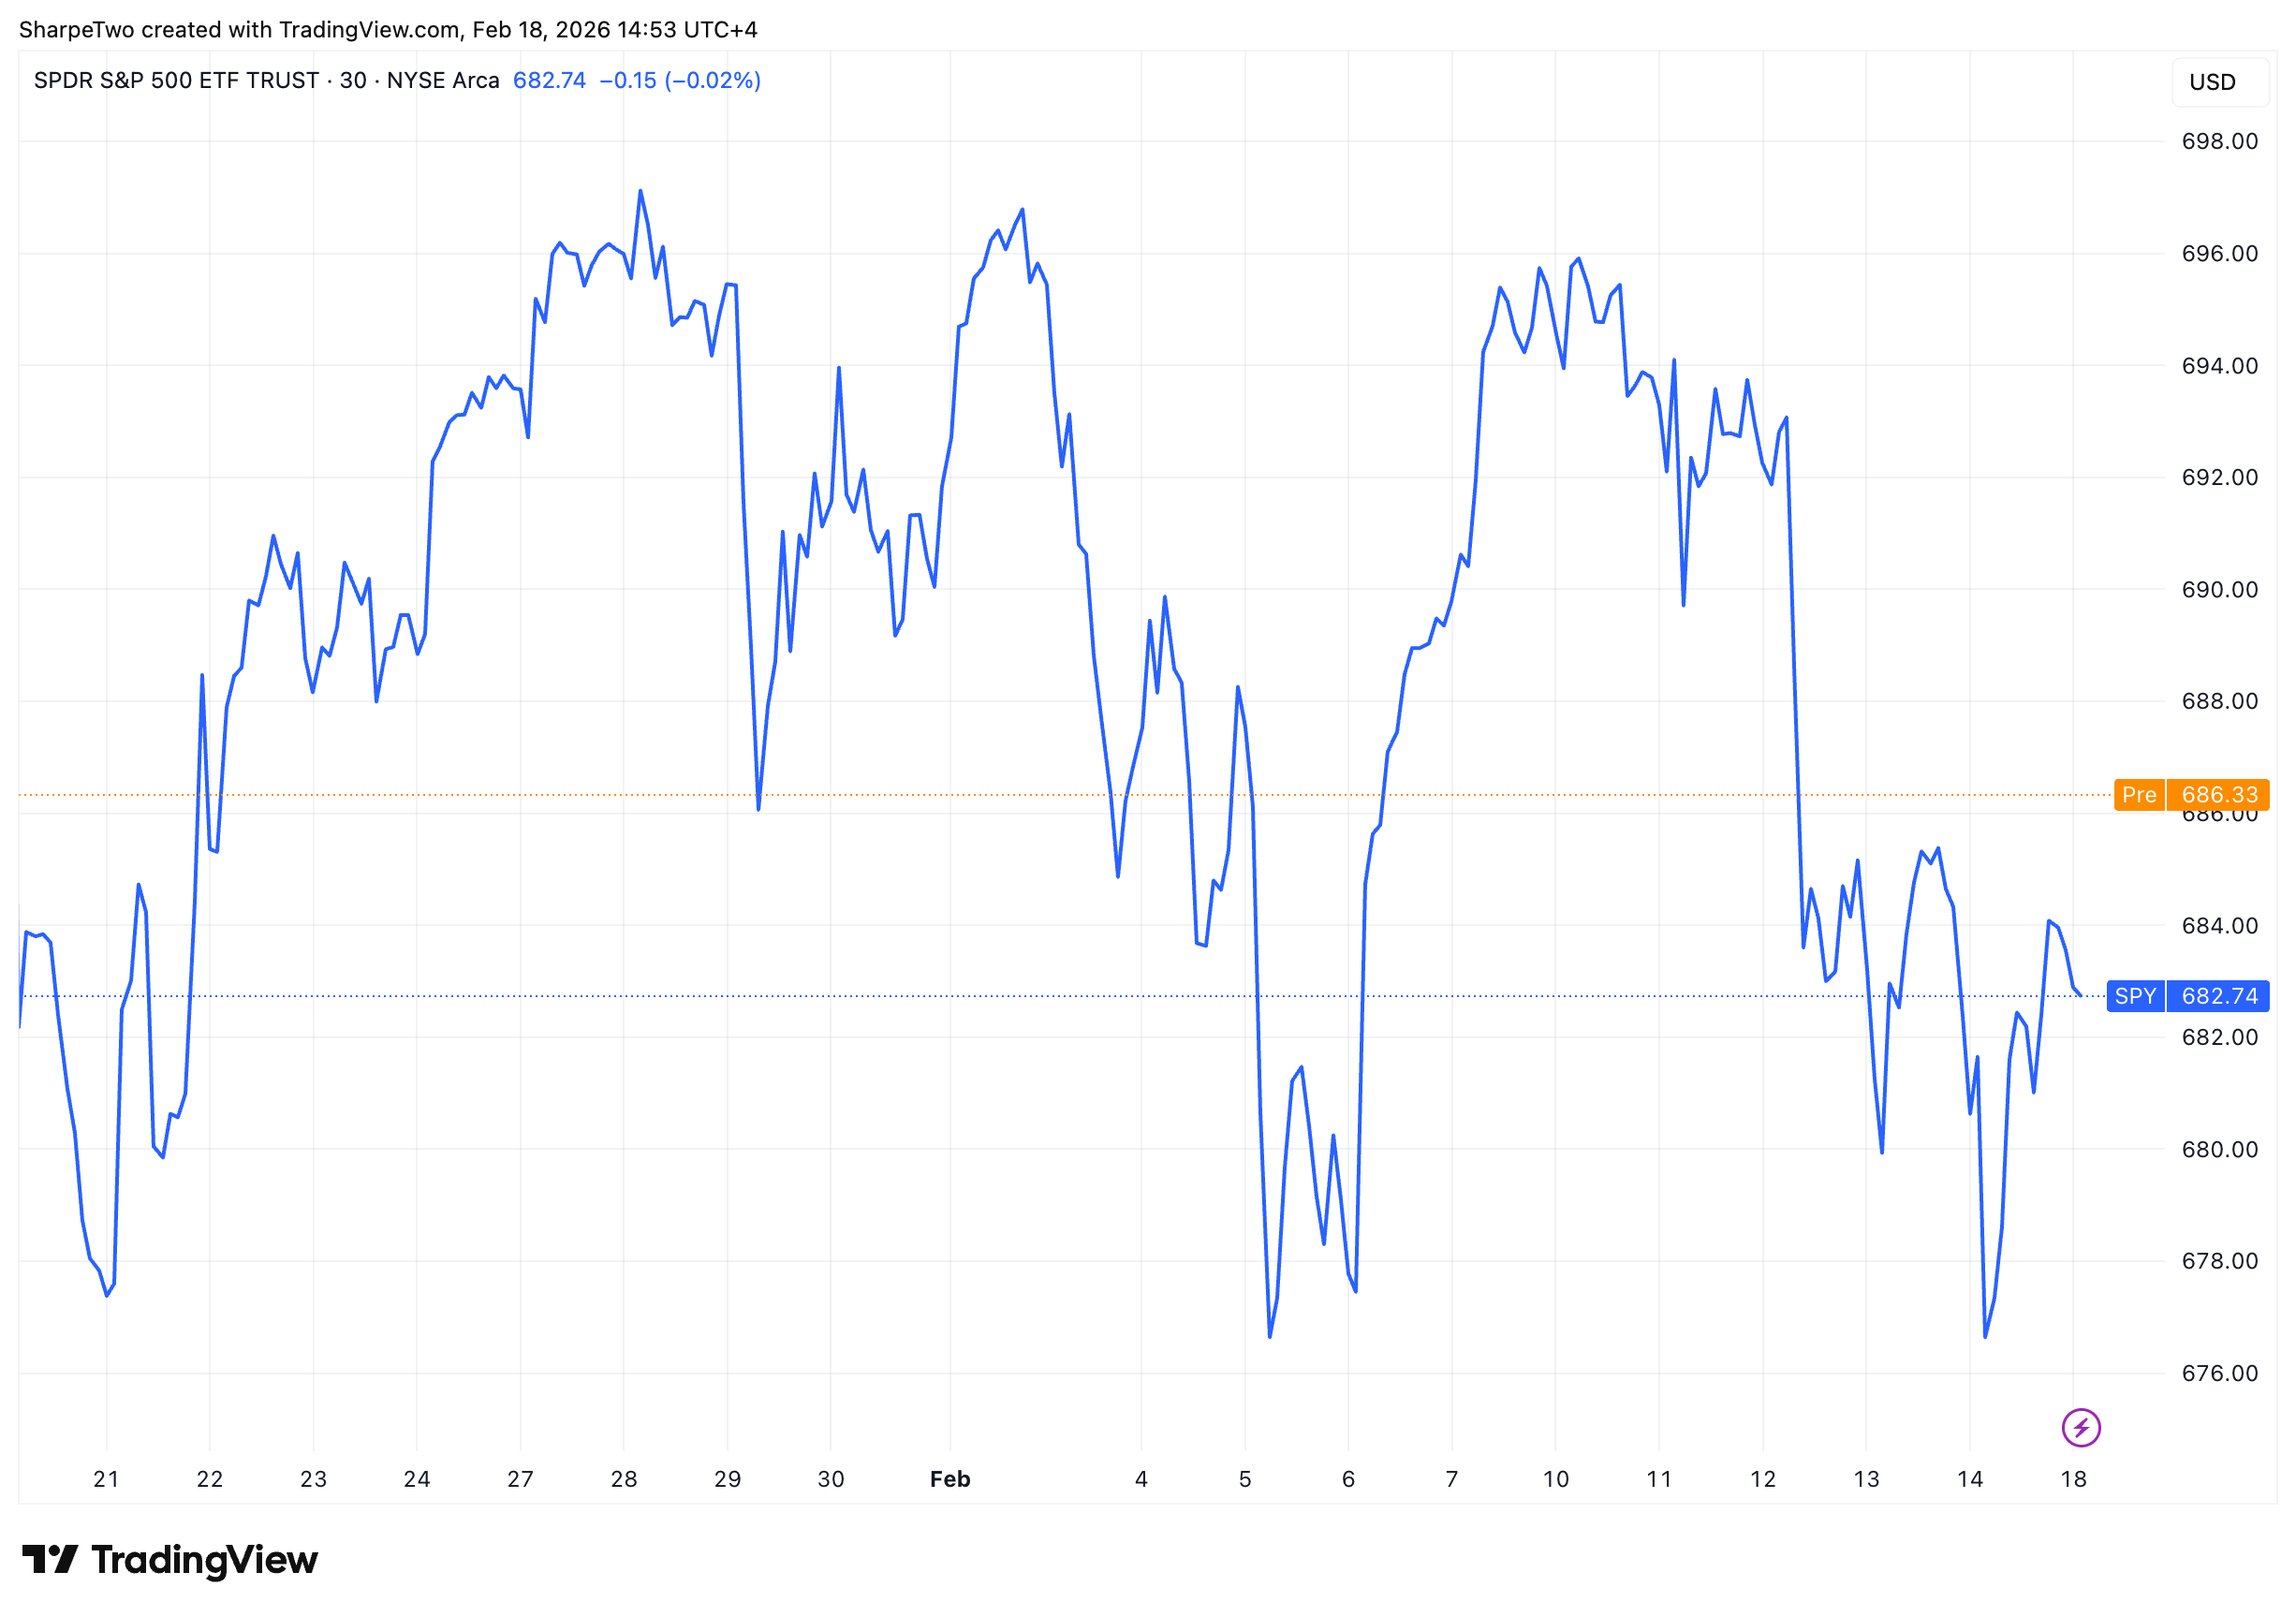
Fortunately, that was not the case here. US indices have been defined by indecision, trading sideways for much of the last few months, and the last two weeks were no exception. (A side note: do not fall into the trap of assuming this chop will last forever; catalysts like the upcoming NVDA earnings could easily disrupt this range).
Back to the dissection: the trade became profitable quickly. Depending on your entry on Thursday, this could have been a "one-day-in-trade" scenario. By early the following week, there was ample opportunity to exit.
A valid question arises: should we have held the trade longer?
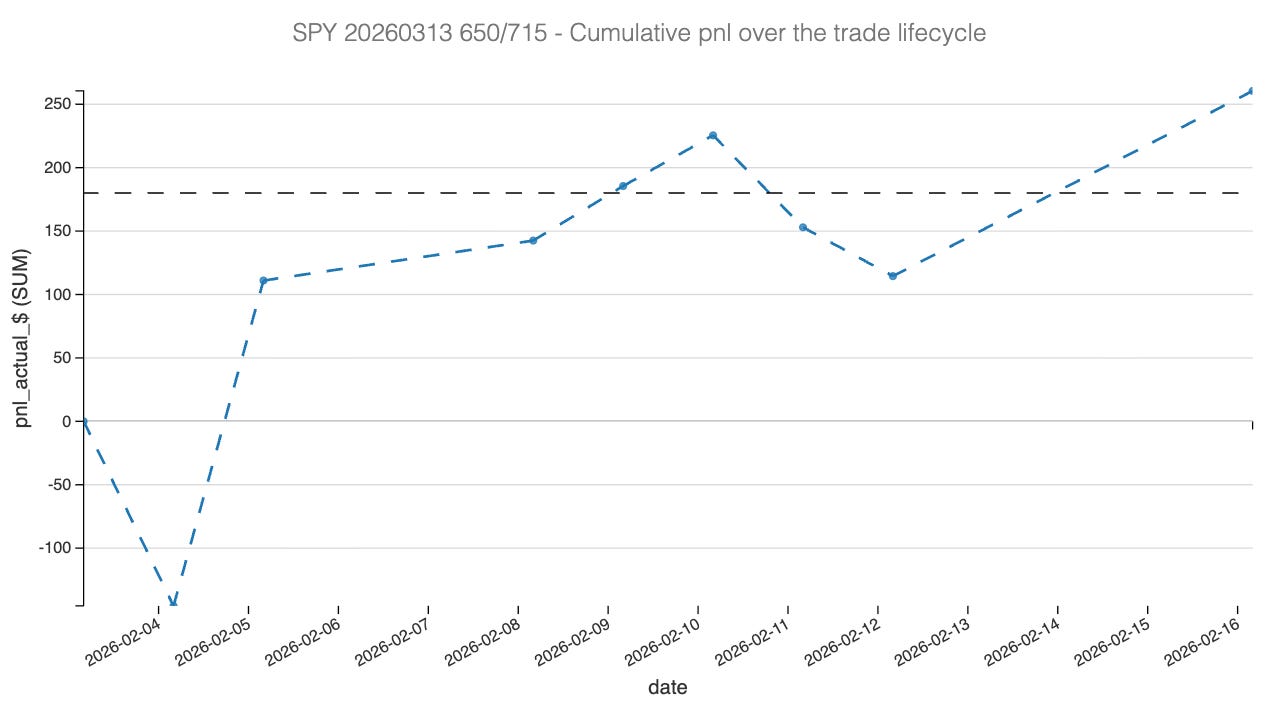
There are strong arguments for staying: the edge was still present, and the probabilities remained in our favor. Yet, we opted to take risk off the table. Why? Because in a high Vol of Vol regime, stability is fleeting. As seen in the PnL chart, as soon as implied volatility ticked up again, often by 2 or 3 points in a single move, it hurt the PnL.
We are not advocating for day-trading implied volatility, but we must recognize the environment we are in. Low volatility is unlikely to stay low for long in this regime. Therefore, securing profits is often the superior decision compared to overstaying your welcome.
The Greek Pnl Attribution
Looking at the attribution, the narrative of this trade is defined by the successful capture of a high Variance Risk Premium, driven effectively by two powerful engines: Theta and Vega.
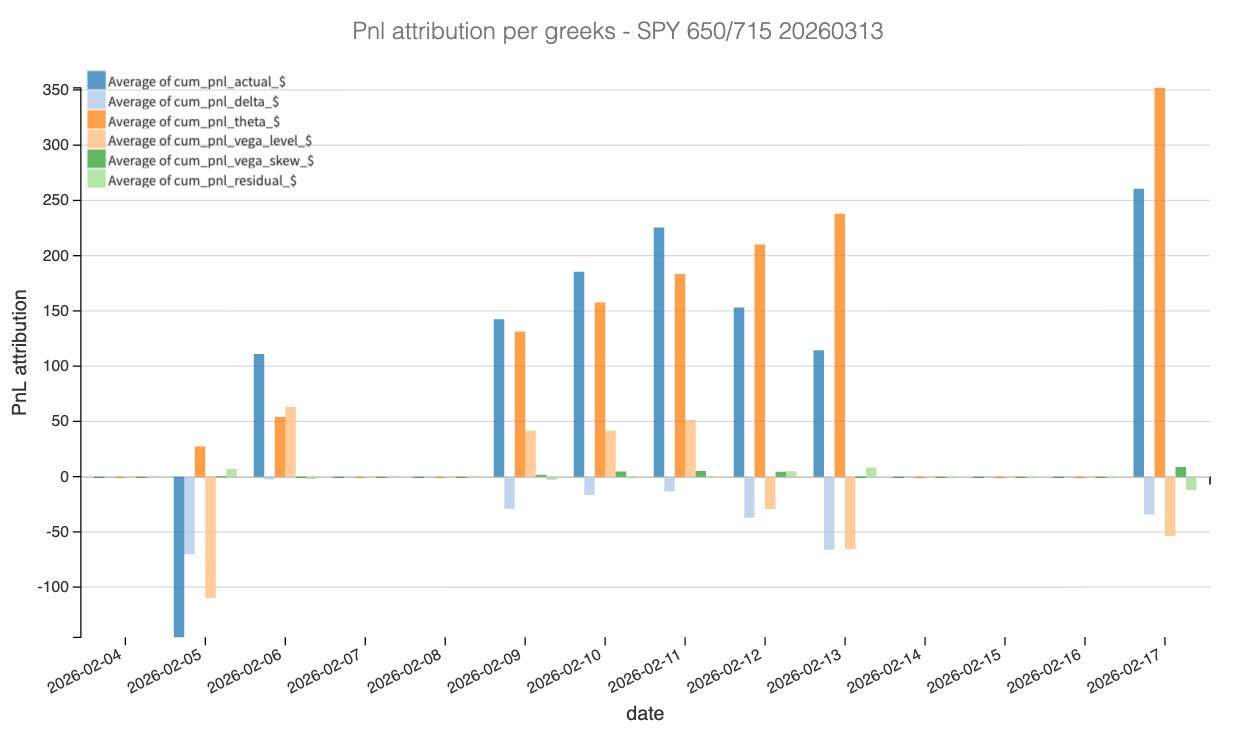
As illustrated in the cumulative PnL chart, the equity curve suffered a sharp drawdown almost immediately on February 5th. This initial dip was driven by negative Delta and a temporary expansion in volatility, features of the stress and high vol of vol regime we were navigating. However, the recovery was swift and decisive. Theta (the orange bars) acted as the primary driver throughout the lifecycle, relentlessly harvesting premium from the 650/715 strangle as the underlying price remained within our wide structure.
What distinguishes this trade is the significant positive contribution from Vega (the light orange bars). We entered this position during a “Stress” regime characterized by high “Vol of Vol”. While this volatility expansion caused the initial mark-to-market pain, it ultimately became a source of profit. As noted in the post-mortem, implied volatility was “crushed” shortly after entry, mean-reverting from the elevated levels we sold. This rapid contraction allowed Vega to shift from a risk factor into a profit generator, effectively supplementing the gains from time decay.
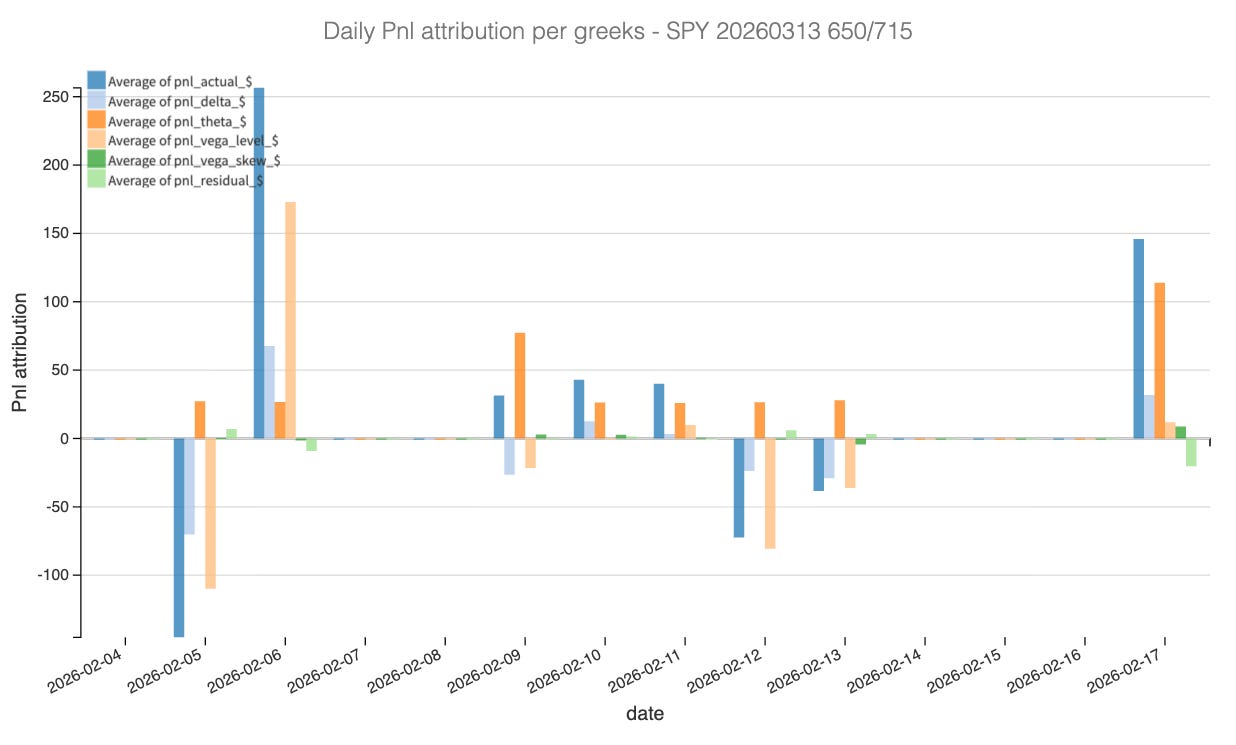
This dual contribution from Theta and Vega was crucial outgrowing the drag on performance driven by delta. The daily attribution chart reveals that the market’s indecision and sideways chop resulted in Delta losses, particularly on February 5th and 12th. However, because the structural decline in implied volatility (Vega) combined with massive time decay (Theta) was so potent, the strategy easily absorbed the directional noise.
Now should we go back in this position or not? Let’s have a look.
