
Signal du Jour - short vol in EWZ
Vintage from our fav' trade in 2023.
We won’t lie— we’ve found the back-and-forth in oil much more enjoyable than the rollercoaster ride in Chinese equities. It’s a perfect example of how path dependency plays into volatility. You might be selling at a great price but end up way offside because you're not delta hedging, and the market decides to go wild in one direction. And that same path dependency can make you look like an oracle when prices return within the boundaries of your straddle.
Well done if you held onto the trade for two weeks without throwing in the towel. But let’s be clear: we wouldn’t have recommended it, and you can thank luck for that win. A smarter approach? Restructure your position by restriking your straddle to the money (once a day is enough) until the market finally stabilizes.
While the US, the Middle East, and China have been hogging all the attention lately, the world is vast, and many other markets are ripe for the taking. Today, we’re revisiting one of our favorite darlings we’ve ignored over the last six months: Brazil and EWZ, the ETF tracking Brazilian equities.
Let’s dive in.
The context
Brazilian equities have had a rough year. They are now down a solid 17% year-to-date, significantly underperforming the SPY. Most notably, this year's standout trade has been short Brazil and long Argentina.

The political climate in Brazil has been tense, which has understandably shaken investor confidence. Coupled with poor recent economic data, it’s no surprise that reinvestment into the country has been lukewarm at best.
From a volatility standpoint, however, things didn’t spiral out of control. We didn’t witness any significant spikes in realized volatility, not even in June, which was relatively uneventful from a volatility perspective.

Currently at 19%, we’re in the middle of a fairly consistent year for volatility in Brazilian equities. Based on this chart, it’s hard to envision realized volatility shooting much higher than 24%. Of course, political risk always lurks in the background, and we can never predict every twist, but nothing on the calendar gives us cause for concern, which lends more credibility to our predictions.
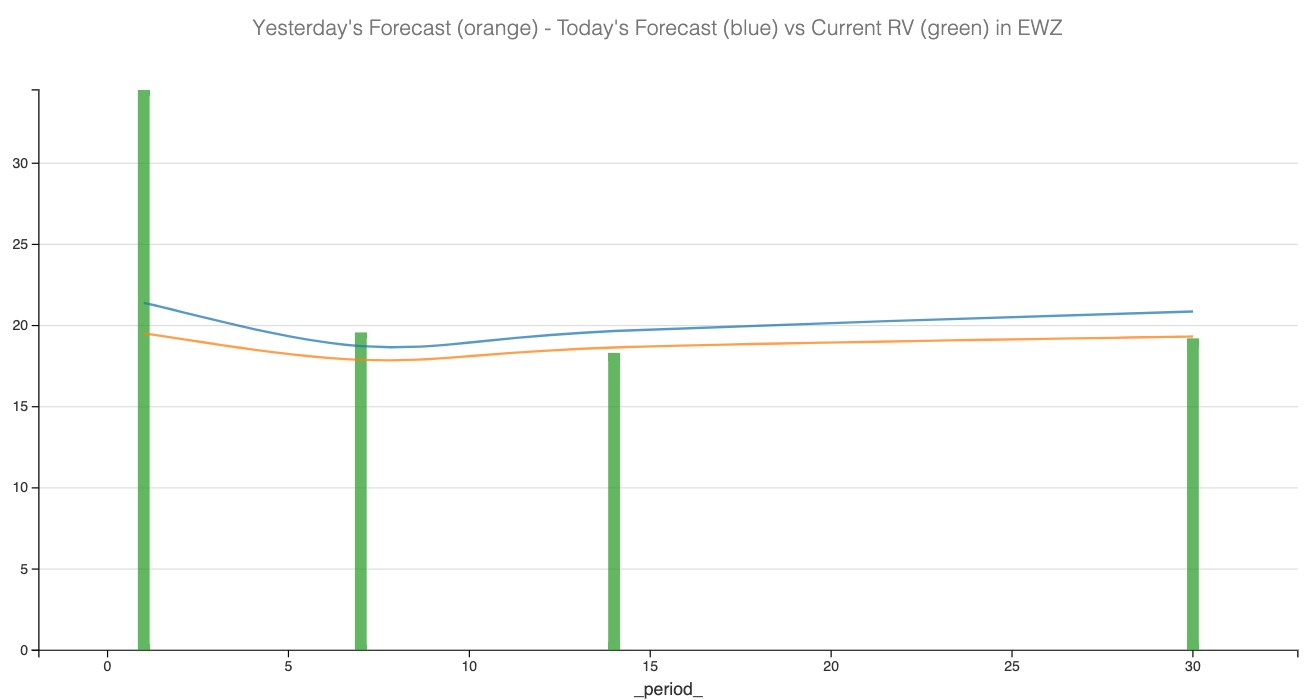
We forecast realized volatility to hover around 20% over the next two weeks to a month. With that in mind, let’s examine the options data to see how we could structure a trade in this product.
The data and the trade methodology
Let’s start by comparing the realized volatility at 30 days with the implied volatility derived from options prices (using the CBOE VIX methodology).

