
Performance Review
An update on our approach to vol trading, leading to Sharpe 4.
That is a longer one than usual, if you are here just for the discounts, here they are; 40% off the Substack yearly plan and 20% any of our yearly plan for the platform. Why taking advantage of them? We achieve sharpe 4 since the switch to predictive analytics. The leap forward justifies the price… even more at a discount! Go for it!
It is still hard to believe that it has been more than two years since I wrote my first email on Substack to talk about volatility and financial markets in general.
I am grateful for the friendships made along the way (Hugo, Si, Raul, Nimish, Saran, Loren, Mati, the list is long), and for those of you who have been around since the beginning, I want to extend a sincere thank you for your support. It has been instrumental in what Sharpe Two is today: a newsletter, but also a product where traders can access sophisticated volatility signals that actually make money.
Needless to say, the approach has drastically changed over the years. From a basic comparison of ATM straddle prices to the absolute movement observed in the underlying, to a full view of the volatility surface, and most importantly predictive capabilities on whether the implied volatility observed today will exceed subsequent realized volatility. It has been three years of intellectual challenges, sleepless and sometimes quite depressing nights, yet extremely rewarding on many fronts.
I had to accept early in the journey that what worked 15 years ago was no longer enough to make a living trading volatility. You needed to be more sophisticated to trade options successfully, and get one step closer to what is done on a quantitative trading desk.
This led us to compute realized volatility using high-frequency data, reprice variance swaps with options quotes, and be more creative in how we look at skew. We also started incorporating key, yet often ignored, metrics in the retail space, such as the slope of the term structure, volatility of volatility, or spot/vol correlation. And not forgetting the very important economic calendars that set the tone of the market every day.
The results are strong, and a stark contrast with last year. While we had an outstanding performance last year, primarily driven by poorly priced overnight risk in 0 dte and the excess of variance risk premium in the S&P 500 in the months leading up to the election, we were also lamenting how VRP strategies across a wide set of ETFs failed to deliver what we expected. And being quite competitive, there was no way we would moan about it a second year in a row, when harvesting the variance risk premium remains one of the most common and sustainable ways institutional options and volatility desks make money.
It has been only three months since the first articles relying on this approach were published, yet the switch to a predictive framework has surpassed both our own expectations and those of our early customers. There is no better satisfaction than receiving messages mentioning a Sharpe ratio closer to 4 than 2, or simply saying that after years of trying quant tools, they finally have a platform where they can leave the guesswork aside, focus on the best ideas of the day, and ultimately make money.
So far, it matches what we observed in the backtests. It has proven robust to regime changes like those seen in October and November, and while a true tail event would still be needed to fully understand how it reacts, it already delivers where it matters most: it gives us back time to think when the market is stormy.
While Substack readers see a perfect record of 14 out of 14 in the Trade Anatomy series, platform subscribers also have access to the Discord and see the trades we put on every single day. Out of 70+ trades, only 7 lost money, and by doing something as simple as trading one lot each time, we made more than $3k. On a reasonably small account, that is over 10%.
Because it is the end of the year, we are offering a 40% discount on the yearly Substack subscription, and 20% on the product. If you want to understand how this can help you, the rest of the article is for you. Like last year, what follows is an in-depth analysis of the trades we have put on since launching the product. And although this is not audited yet (more on that at the end of the article), there are now a few dozen people who can validate this.
Let’s dive into the data.
As a reminder, the dataset is available for paid subscribers, don’t hesitate to ask for it.
A reminder on the methodology
We trade primarily on the short side of volatility to harvest the variance risk premium. This requires having a view on whether the variance implied in today’s option prices is likely to exceed the subsequent realized volatility over the life of those options. To do that, we now rely on well-calibrated machine learning models, trained on roughly 50 different features, with an AUC around 0.7, explicitly designed to answer that question.
The most important features are also quite recognizable to anyone who trades volatility, and there is nothing here that cannot be explained or understood. It was critical for us to implement SHAP values to explain which features the model relies on to reach its predictions, rather than leaning on something our intuition could not validate. Essentially, we built an assistant more than a black box.
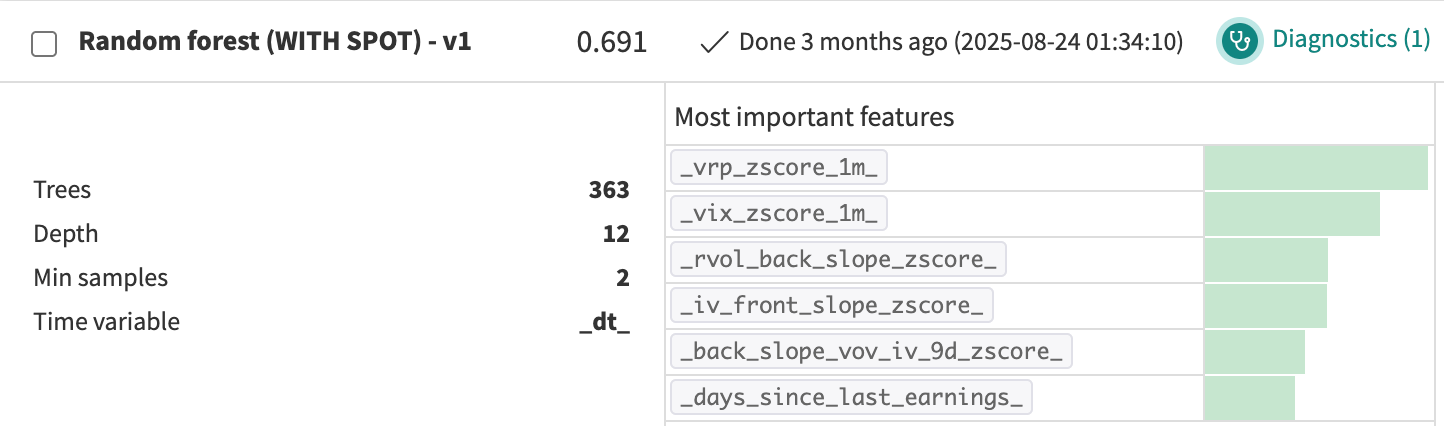
Here is a view of our most important features. We do not consider that there is anything here that is not already well documented across the internet and in academia. The hard part is the engineering. If you try to build all of this by yourself, we wish you good luck, and do not hesitate to reach out if you want a few pieces of advice. Otherwise, well… subscribe to the platform ;)
Every day, we access our model predictions through this table, which our paid readership should now be familiar with.
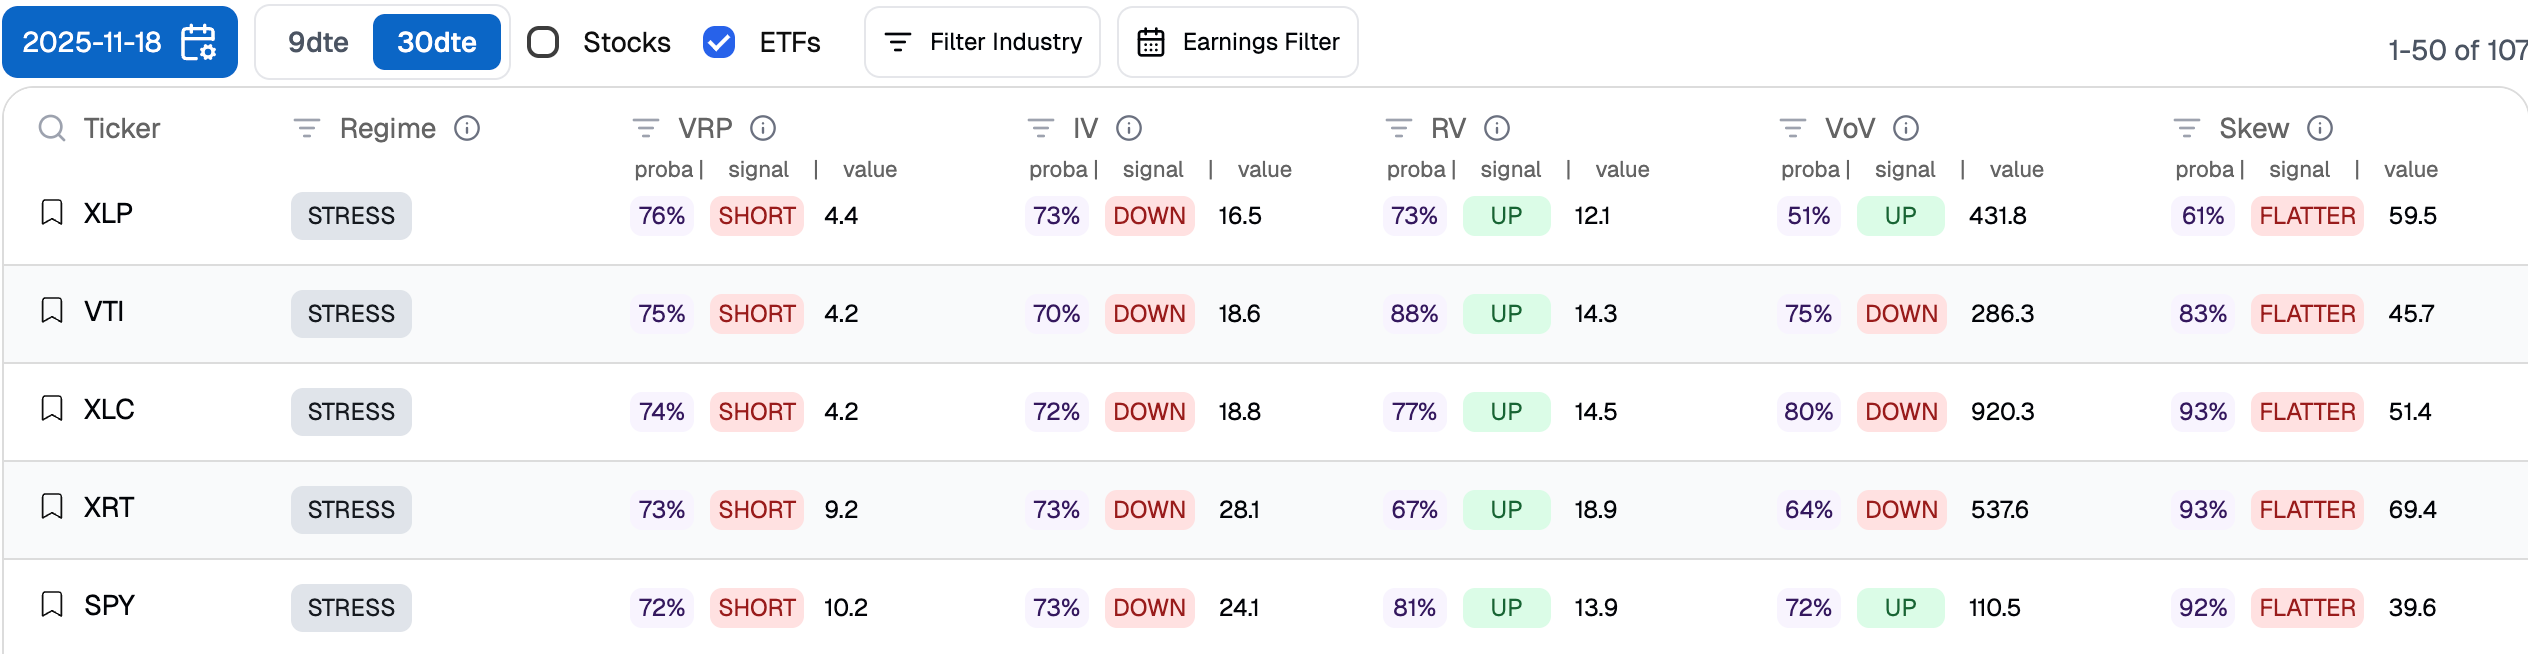
For instance, on November 18, variance in SPY was overpriced. In hindsight, of course, everyone would tell you that this was an obvious trade. But at the time, we do not recall many social media accounts willing to stick their neck out and say that selling volatility with VIX at 24 was a good idea.
This approach also allowed us to trade adjacent tickers, less influenced by the dominant market narrative (AI, tech bubble, and so on), and instead focus on sectors where the volatility surface itself was distorted by sentiment, leaving genuine opportunities on the table.
That is the essence of how we trade every day: look for the best odds, add a layer of discretion and validation to decide whether a trade makes sense, and then focus on execution.
As for the backtested results, which help build confidence, we focus mostly on ETFs, where idiosyncratic risk is less prevalent than in individual names. Our main driver is the probability that implied volatility at 30 dte will exceed subsequent realized volatility. We want that probability above 66% to feel comfortable putting a trade on. We also make sure that the same probability at 9 days gives us, at the very least, a short signal, and ideally a probability above 60%. These are indicative thresholds we use in the Discord, but one can always adjust them to match their own comfort level. That is the beauty of a self-service idea generation platform.
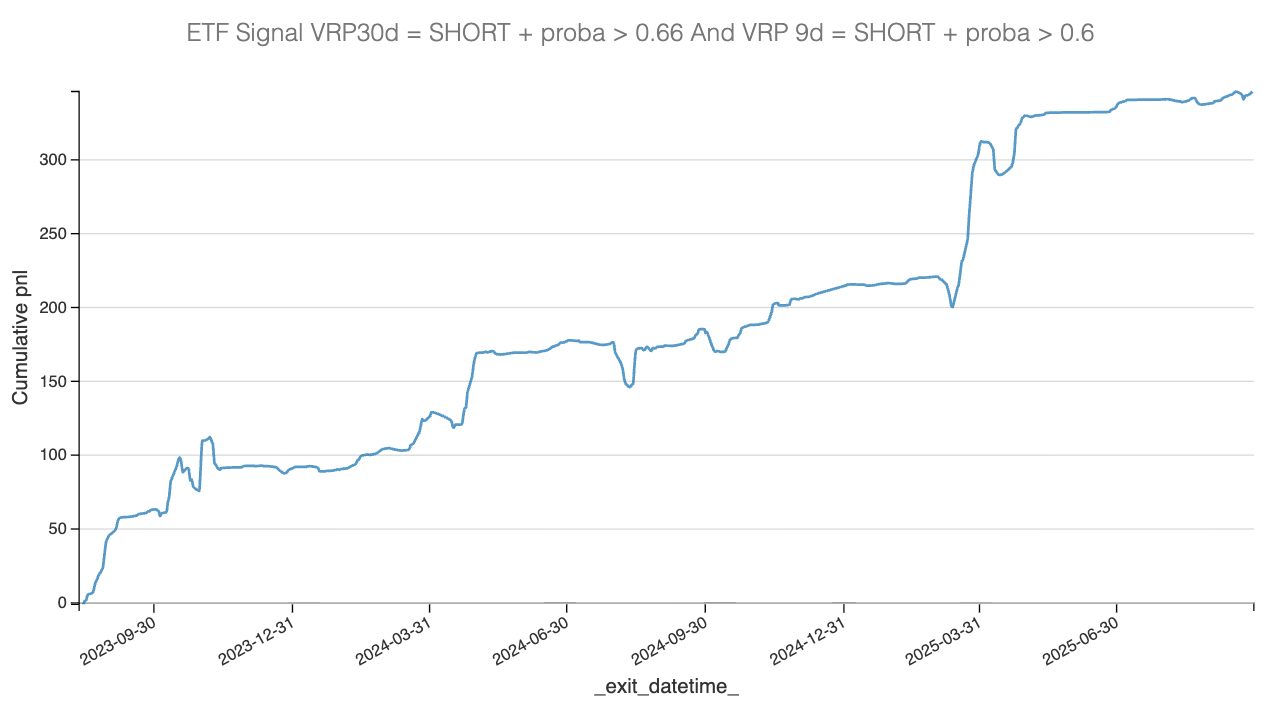
This backtest PnL curve assumes selling an ATM straddle in the 28 to 35 dte range, holding it for two weeks, with every trade standardized to $1 of credit received. This leaves room for further optimization based on how volatile the underlying asset is. That said, if your account does not justify these optimizations, you can safely ignore them and simply trade tickers that are small enough for your account.
This backtest is quite different from how we trade in practice. We tend to focus on 20 delta strangles, as their vega profile is much closer to a variance swap, which is what we use to compute these probabilities. We also tend to exit trades after collecting 25% of the credit, and the 14-day mark is a hard stop. Still, the curve is strong and gave us the green light to not only trade it ourselves, but also expose these results in the product.
Once again, this is not financial advice. We did the research to the best of our abilities, and while this curve is extremely promising, it will not save you from doing “dubious” things, particularly around sizing, during periods when the market is less forgiving. Trade at your own risk.
How do we deal with potential market routs? First of all, the models still generate long volatility ideas when subsequent realized variance is likely to exceed what is currently priced in options. While we do not necessarily take them systematically, they can be a useful way to fight the inevitable market events.
Otherwise, we simply buy longer-term hedges. It is the cost of doing, and staying in, business, and it helps give the book a more neutral, and ideally convex, profile.
The results
The results are geared toward smaller accounts. Well-capitalized traders could get more sophisticated, but that is not the goal of this article: at this stage, we are not focusing on optimization techniques, but rather on demonstrating the validity of the approach and the edge. We take one lot every time we find a suitable signal. This means no additional risk management in place, and it can create situations where a short strangle in SPY has far bigger consequences than a short position in a much smaller ticker like EWZ.
There have been a few recurring themes over the last three months, and in particular VXX.
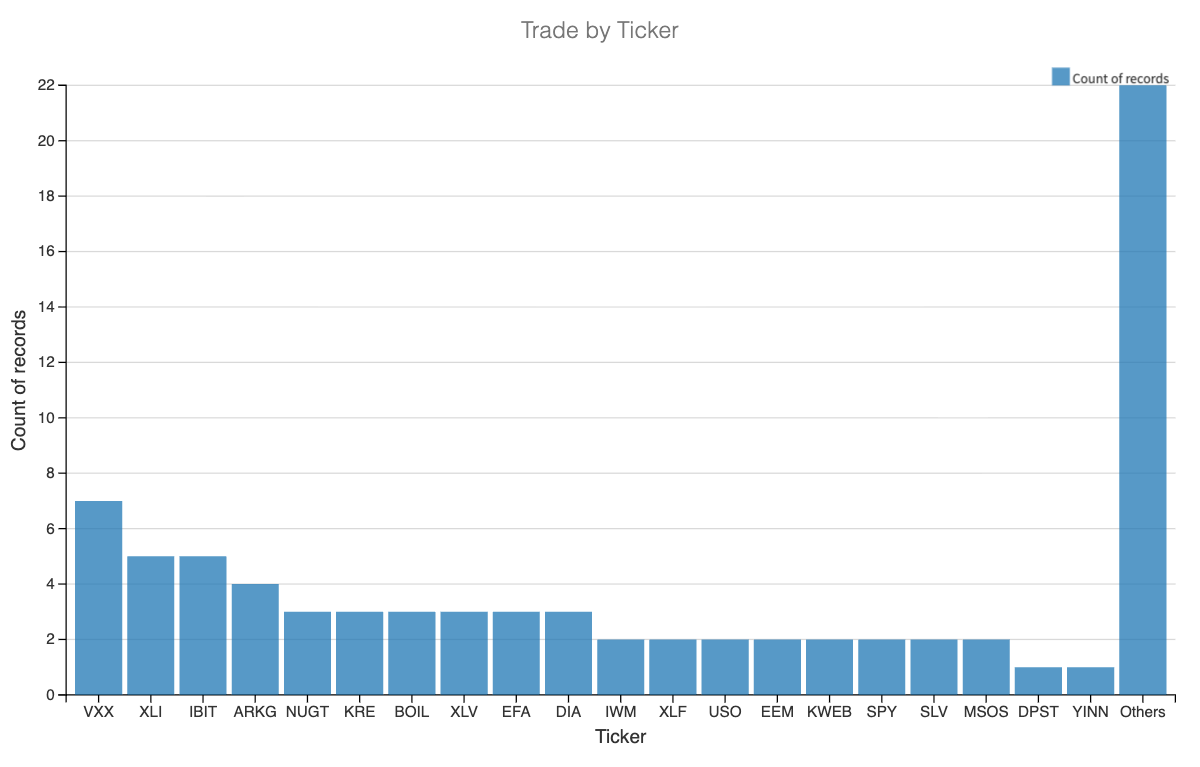
VXX is an interesting case, as we have written about it many times. It is worth having some short variance exposure there, as long as you are strict with risk management, both in terms of sizing and by buying some tails in SPY.
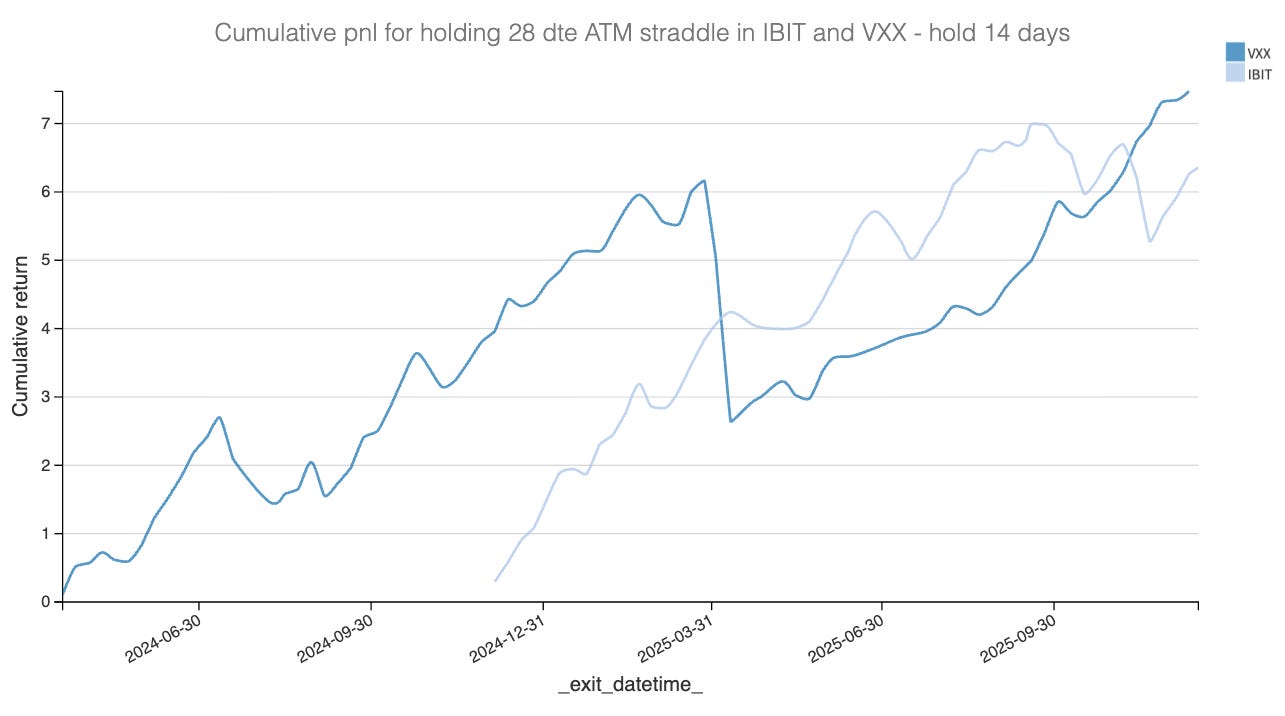
We also had a few trades in IBIT, and it is true that the variance risk premium there is so strong that one could argue these trades may introduce a positive bias into the results. Yet the equity curve keeps a very strong visual message.
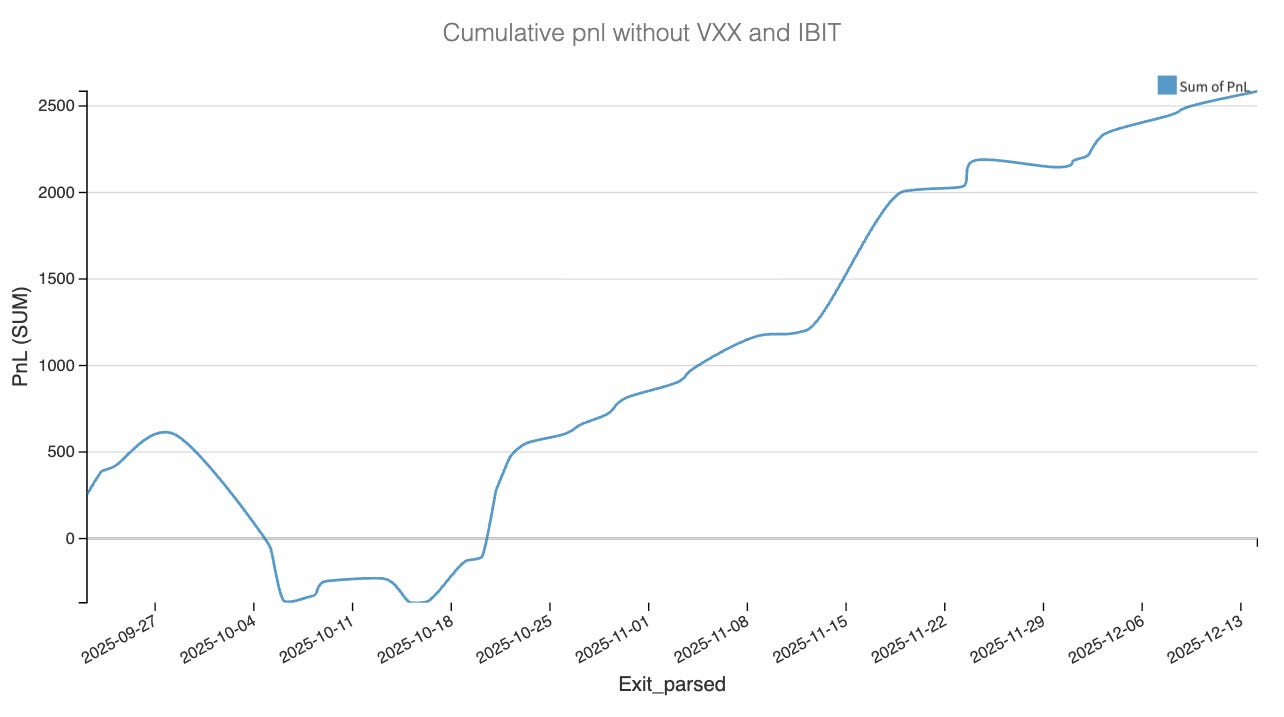
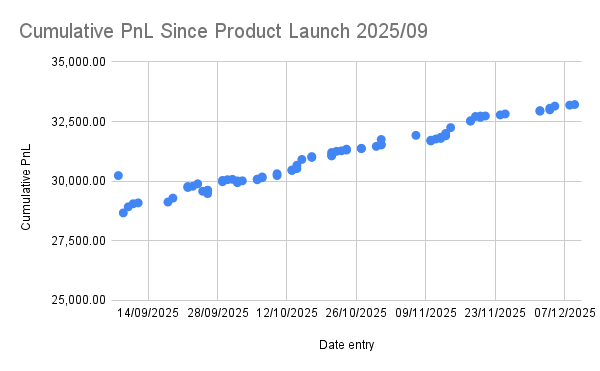
It is also interesting to note that we did suffer somewhat during the market rout in October, before results improved and then stayed steady until now. This is consistent with what we observed in the backtests. While there is clearly an edge, you are still short convexity, which means market routs will hurt more often than not. This shows up clearly in the PnL distribution.
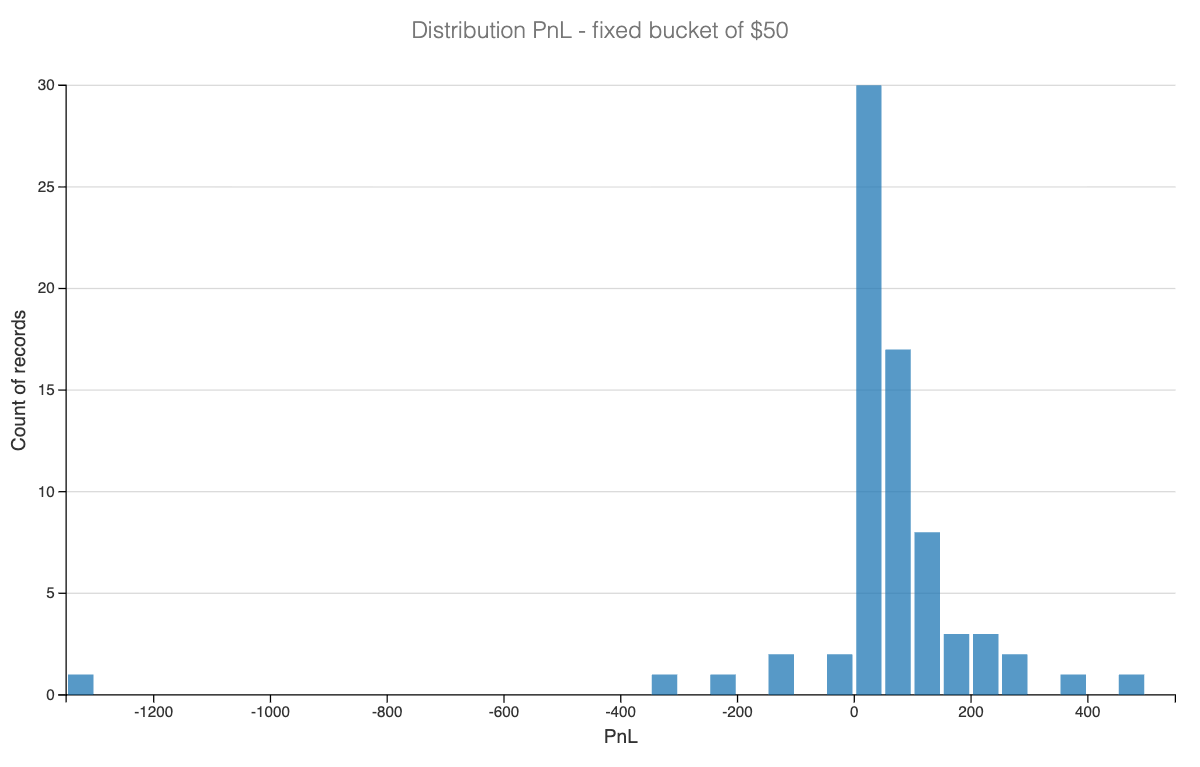
We observe the classic distribution of many small, steady gains, once again exiting after collecting 25% of the credit, punctuated by occasional heavy losses. The largest losses over the last four months were associated with the gold sector, and once again they deliver a very important lesson.
Let’s dig into what happened.
The curse of path dependency
One of the big stories of 2025 has been the rally in gold and silver. Throughout the month of September, what had so far been an astonishing performance turned into a nightmare for anyone short these products, as precious metals roared above the $4,000 mark. While we were delta neutral, at least on paper, we were not particularly concerned about the rally itself. The problem is that the curse of variance harvesting lies in the path: realized variance can still end up below what was implied, and yet you lose money. This happens, and you should not be too upset about it, as long as you are able to correctly pinpoint what went wrong.
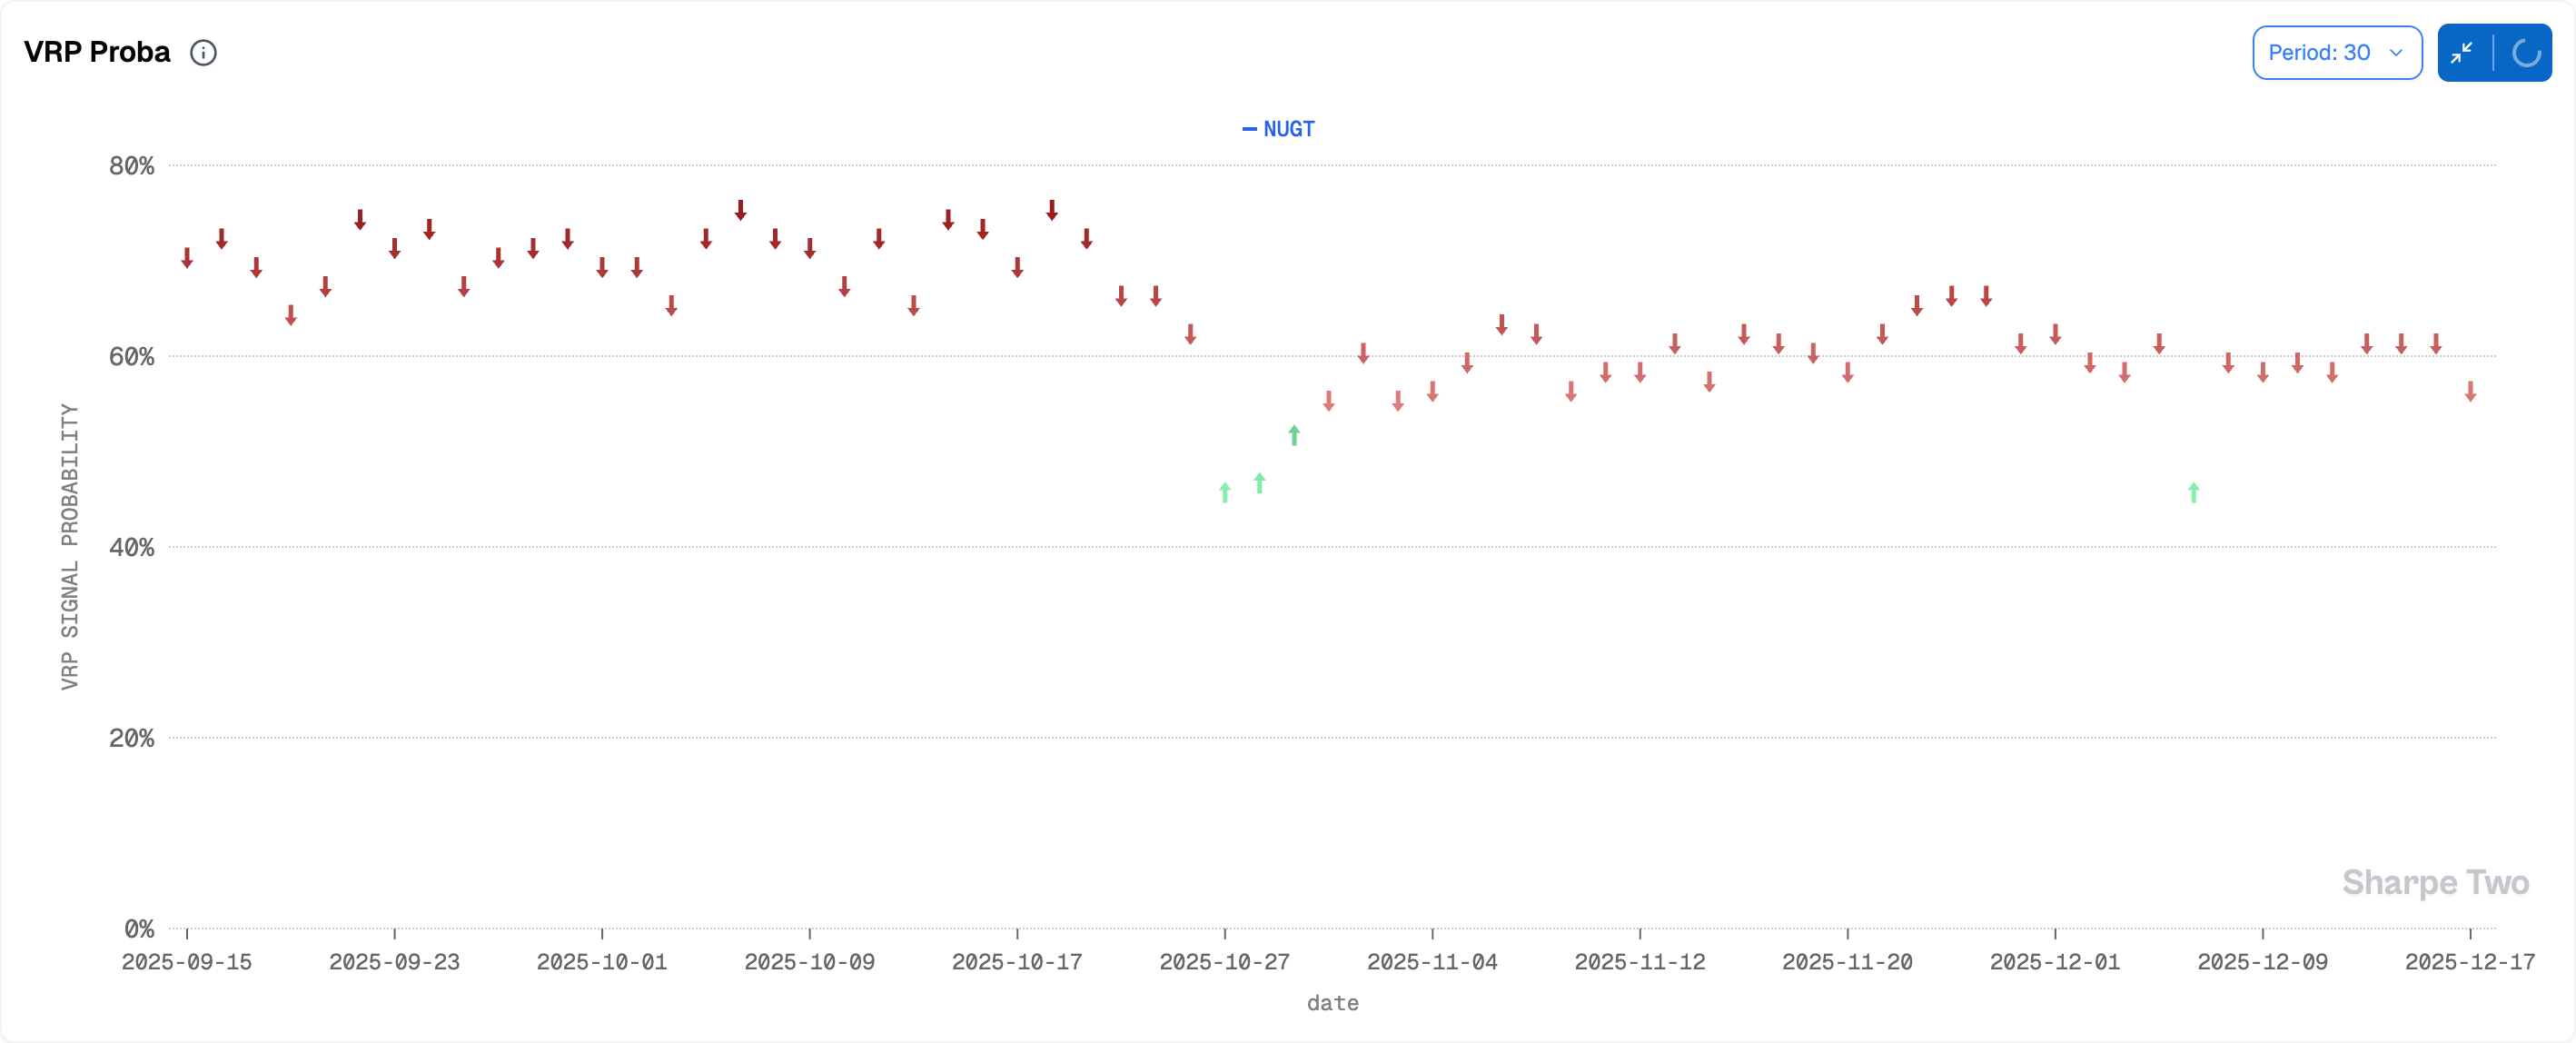
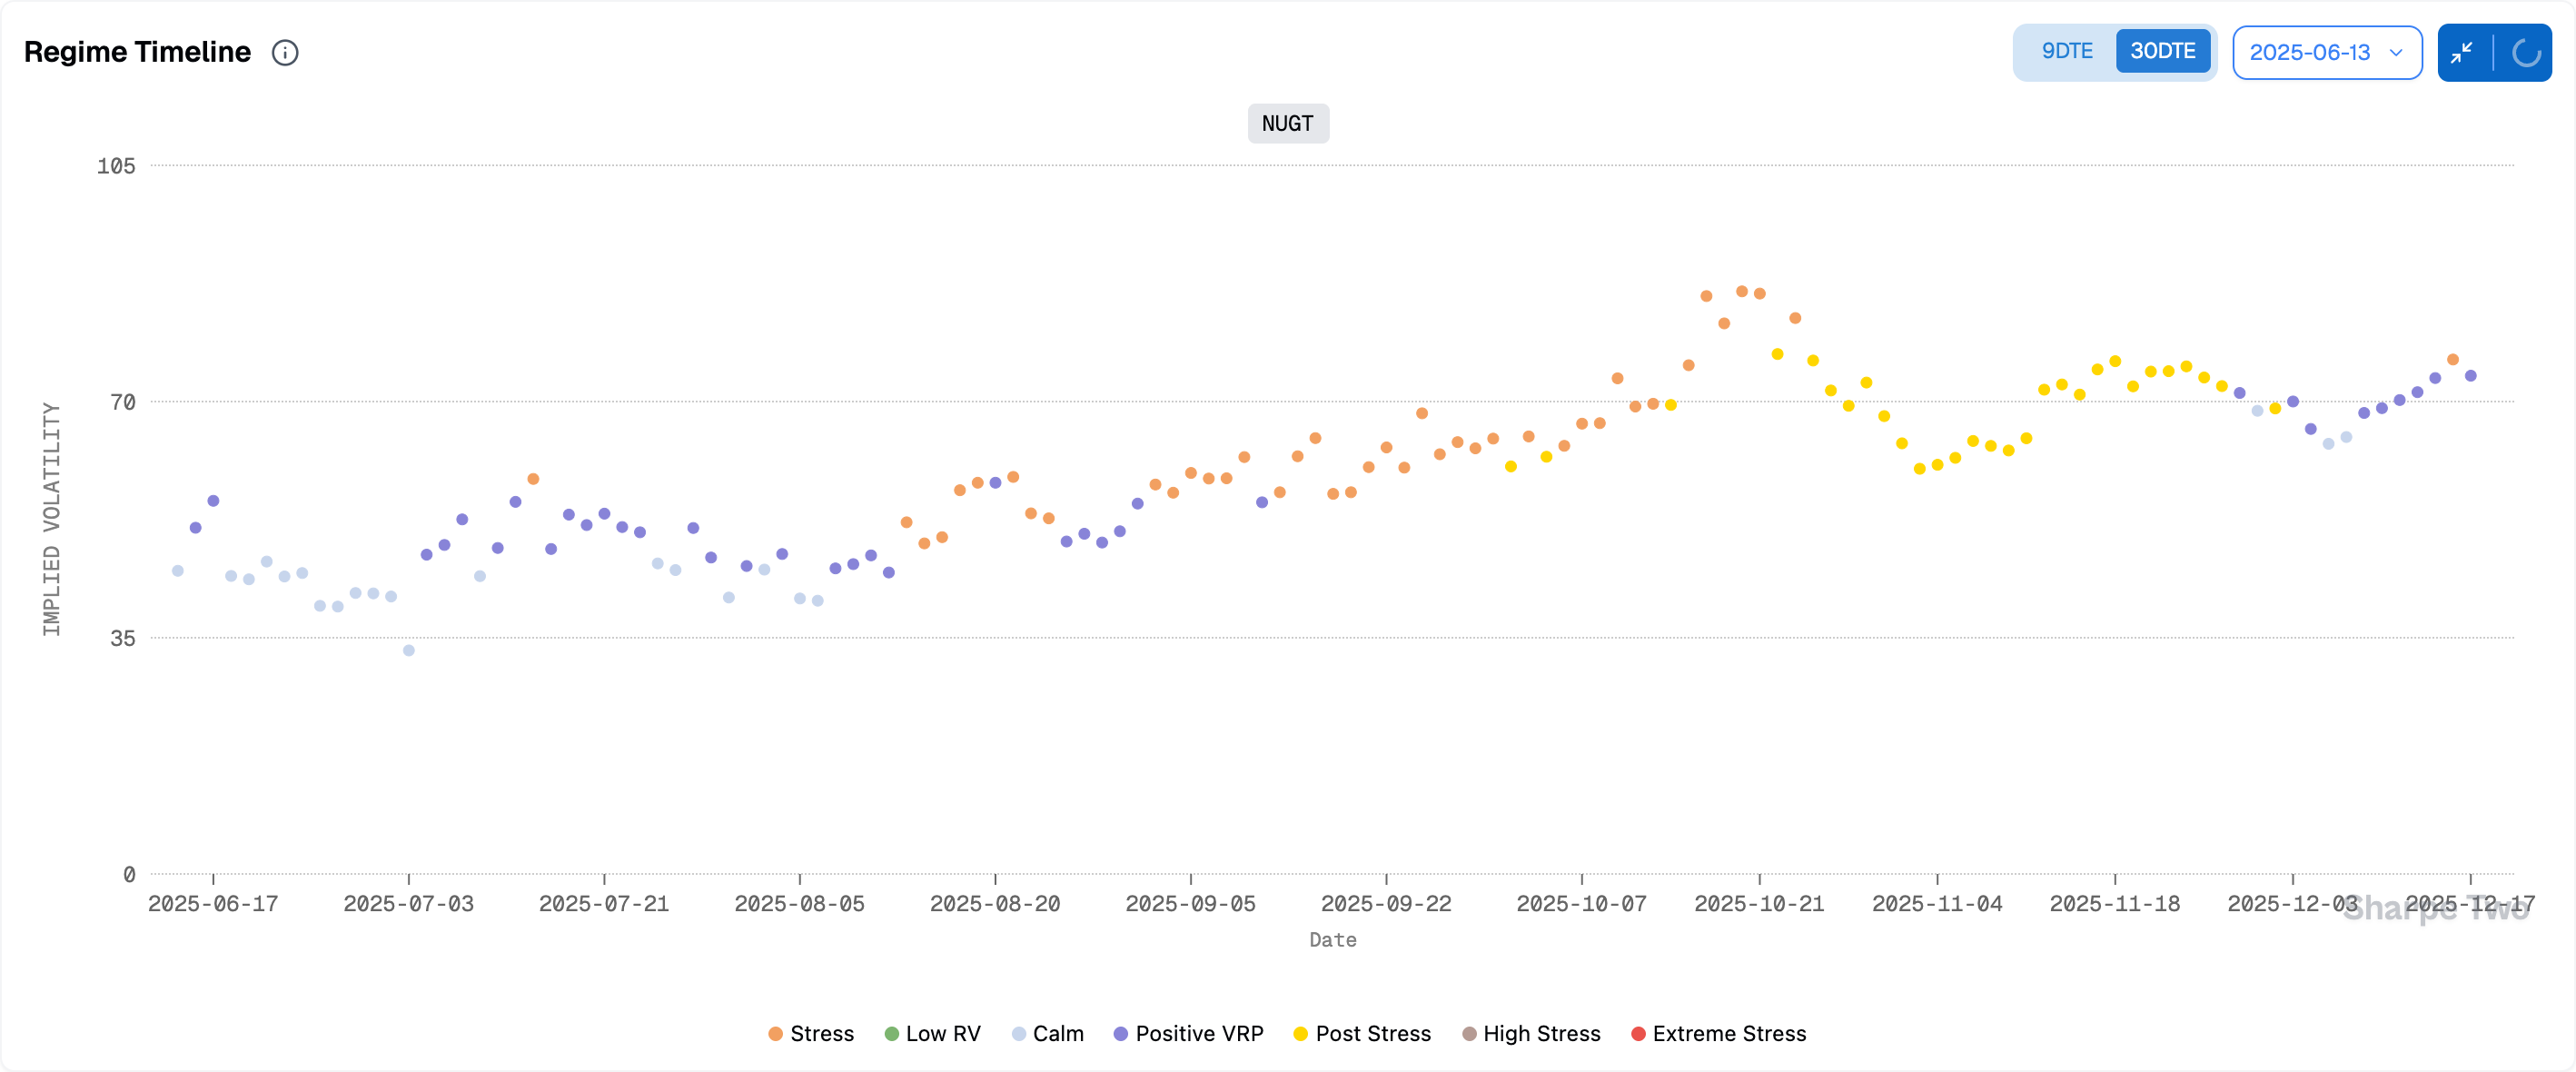
In our case, the biggest loss came from NUGT, the leveraged ETF tracking junior miners. While the signals were strong throughout September and into a good part of October, the relentless upward push in gold meant that the position increasingly resembled a short on the gold sector rather than a pure variance premium harvest. In Greek terms, gamma was inflicting far more daily damage than vega and theta could offset. To make matters worse, implied volatility itself was not cooperating, creeping higher day after day.
In Greek terms, gamma was inflicting far more daily damage than vega and theta could offset. To make matters worse, implied volatility itself was not cooperating, creeping higher day after day.
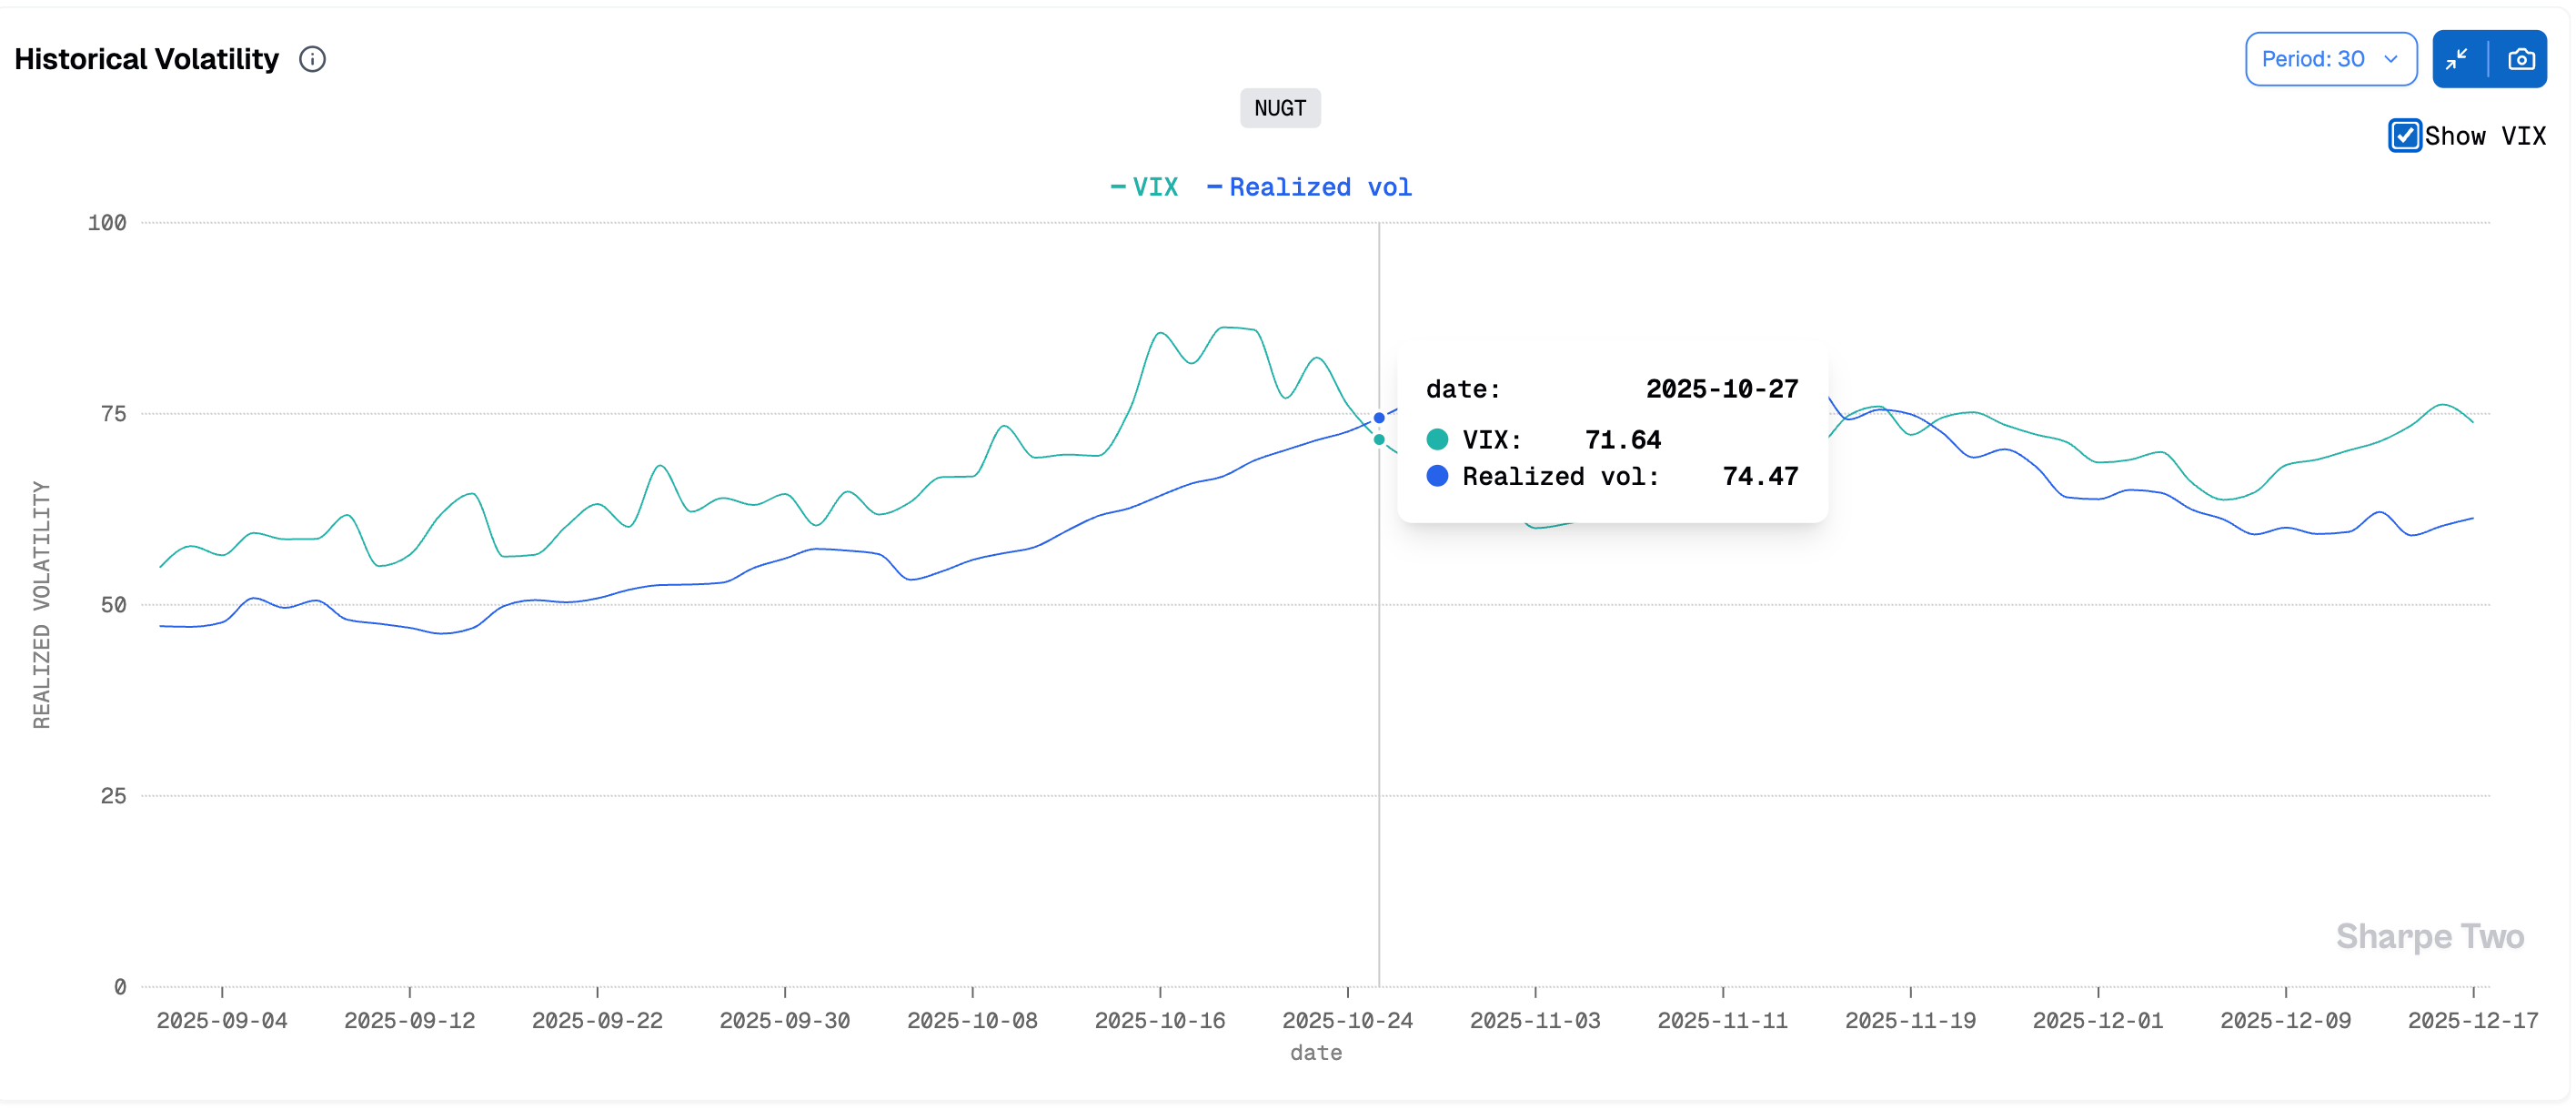
From 56 to 85 in a matter of a month, even when the odds are in your favor and realized volatility ends up close to what you sold, a move like this in vega makes the position extremely hard to keep. NUGT ended up being the equivalent of ASHR for us in 2024. Every year, there is one situation where you enter a trade that looks great on paper, you hold it because you are in the mean-reversion business, until a point where an executive decision is required to stop trading the product altogether.
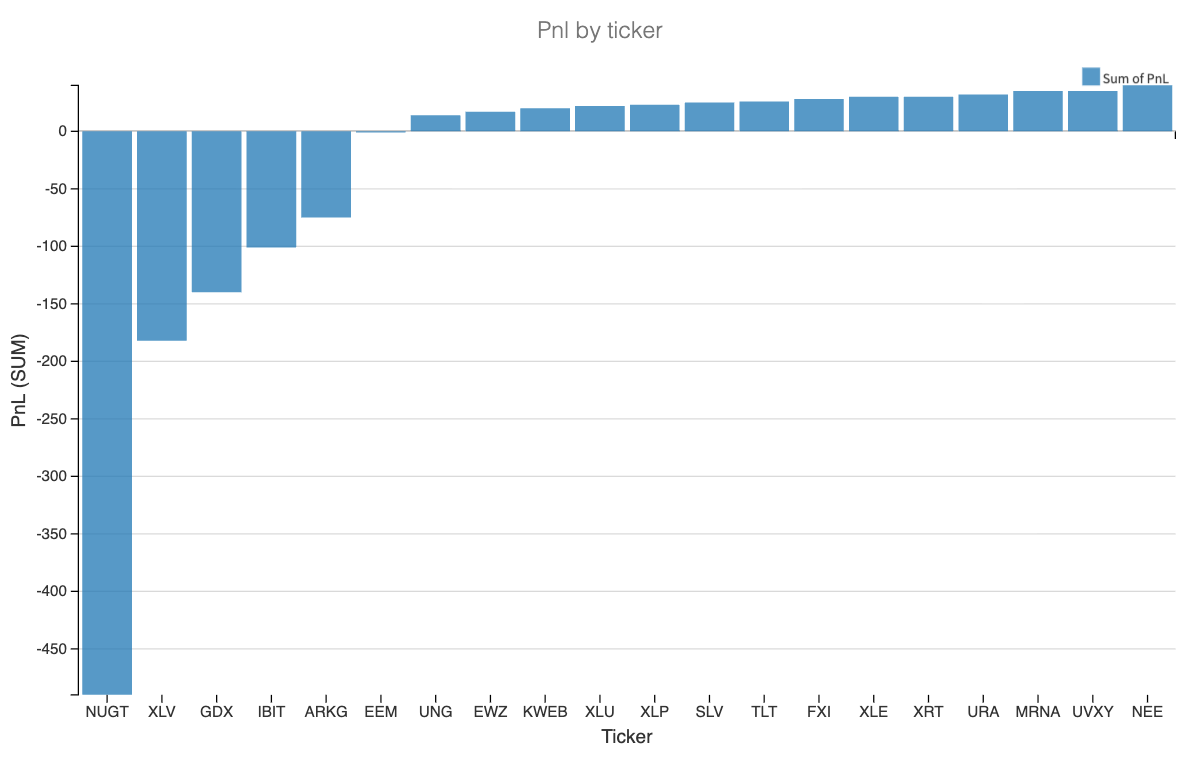
In the end, once we put the gold sector aside (NUGT and GDX are essentially the same trade), we experienced some headwinds mainly in XLV, ARKG, and IBIT, mostly in October, when the market was caught off guard by Trump’s comments on China, followed by Powell’s surprisingly hawkish tone.
Yet, out of 73 trades taken over that period, an average of roughly one per day, we posted a win rate of 90% and a Sharpe ratio close to 4. It is still early to draw definitive conclusions, but this already forms a very solid thesis for going full-time into volatility harvesting, particularly if you ensure that your book is not concave. In practice, this means consistently recycling part of the proceeds from the short book into longer-dated tail hedges.
What is next?
I often get the question of why I do this, and why I put all of this out there. Am I not concerned about seeing the edge disappear?
First of all, to quote my father, “Only bad students hide their work.” Especially at a time where, I insist, almost everything is available on the internet, in books (my personal go-to being anything written by Euan Sinclair, a giant in the retail trading space), or in research papers. The hard part is not the ideas themselves, but the engineering and the design of dozens of data pipelines required to generate clean features and, ultimately, robust models.
Had I been in academia, the natural path would have been to write a paper and publish it. But I am not. Instead, I publish on Substack and make this work available to anyone who prefers renting an options quant desk rather than building one from scratch.
So what should you expect in 2026? More of the product, better features, sharper insights, and ideally better models. That said, I do not guarantee that all of my research will be exposed. The butcher often keeps the best cut of meat for himself. That is the privilege of getting his hands bloody.
More specifically, as hinted at in the introduction, we will make a push on the accountability side. That is one thing I learned the hard way a decade ago, and was reminded of again this year. There are, unfortunately, many phony actors in the retail trading space, and transparency around signals, ideas, and accountability for results is something this industry desperately lacks. I started the Trade Anatomy series to show that a trade idea should not be as transient as a tweet, forgotten and quietly buried in the constant noise of the internet.
Next year, I want to take this one step further. I already have a fairly good idea of how to do it and what it entails, but I will not say much more than this: what about a public and audited portfolio? And if we blow up in spectacular fashion, then our final contribution to the space will at least be a very good laugh, at our own expense.
This will not be financial advice, of course. It will not constitute expectations of future performance, and you will still need to do your own research. But if it can give a clearer picture of what rigorous quantitative research and implementation look like at the retail level, and what kind of performance one can reasonably expect, that would, hopefully, help move the needle in the right direction.
For now, as last year, the full dataset of trades is available to paid subscribers. Remember that there is currently a 40% discount on the yearly Substack plan. As for the product itself, there is also a 20% discount on all yearly plans until early next year.
Happy trading,
Ksander
Hey where's the link to he discord?