
Trade Anatomy - Short Vol in NUGT
Our first loss.
There is a first time for everything. After a perfect run since launching our Trade Anatomy series in August 2025, we are finally recording our first losing trade.
Two weeks ago, we laid out the case for selling volatility in NUGT. At the time, the market was slowly emerging from the holiday lull, still digesting the monster performance of the precious metals sector in 2025, a rally largely driven by geopolitical friction and a global search for dollar alternatives.
We anticipated a relatively calm January where tensions might ease; instead, headlines regarding Venezuela and Greenland thrust themselves back into the spotlight. This geopolitical flare-up pushed precious metals to fresh all-time highs, catching our short volatility thesis in the crosshairs.
This series is vital because it illustrates not just how we make money when the wind is at our backs, but how we lose it and not hide between the “unpredictability” of the market. In this article, we will dissect our original thesis and take a hard look at how realized volatility ultimately derailed the trade.
There is another critical factor to consider: the price of a strangle in NUGT is substantial. A loss in this ticker carries much heavier consequences than a similar move in a smaller, less volatile instrument. This serves as a timely reminder to ensure your account is properly capitalized to withstand the violent ebbs and flows of the products you choose to trade.
Let’s dive into the details.
The trade
In our Signal Du Jour from two weeks ago, we highlighted a short volatility position in NUGT, specifically the 20-delta strangle at the 170/280 strikes for the February 20th expiry. There were plenty of reasons to be cautious, given the relentless strength of the precious metals sector since September 2025. However, at the time, our model signaled a high-conviction opportunity to short volatility and harvest the Variance Risk Premium (VRP).
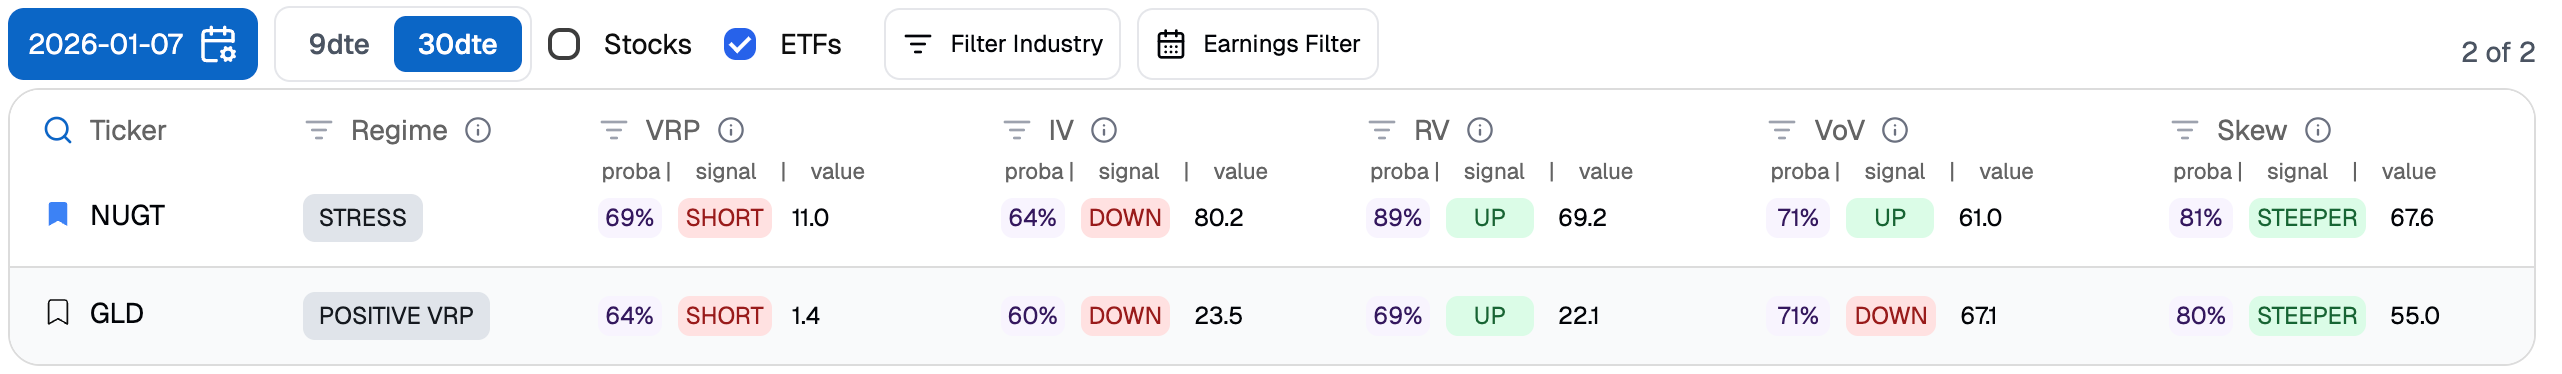
With implied volatility (IV) at 80%, we were looking at a roughly 11-point spread over realized volatility. Even then, we knew we were stepping into a minefield: realized volatility at 69% is immeasurably harder to manage than at 22%. Ironically, we managed to book a profit on a similar GLD trade shared with our Discord group on January 6th, which we held for about ten days.
So, where exactly did things go wrong with NUGT?
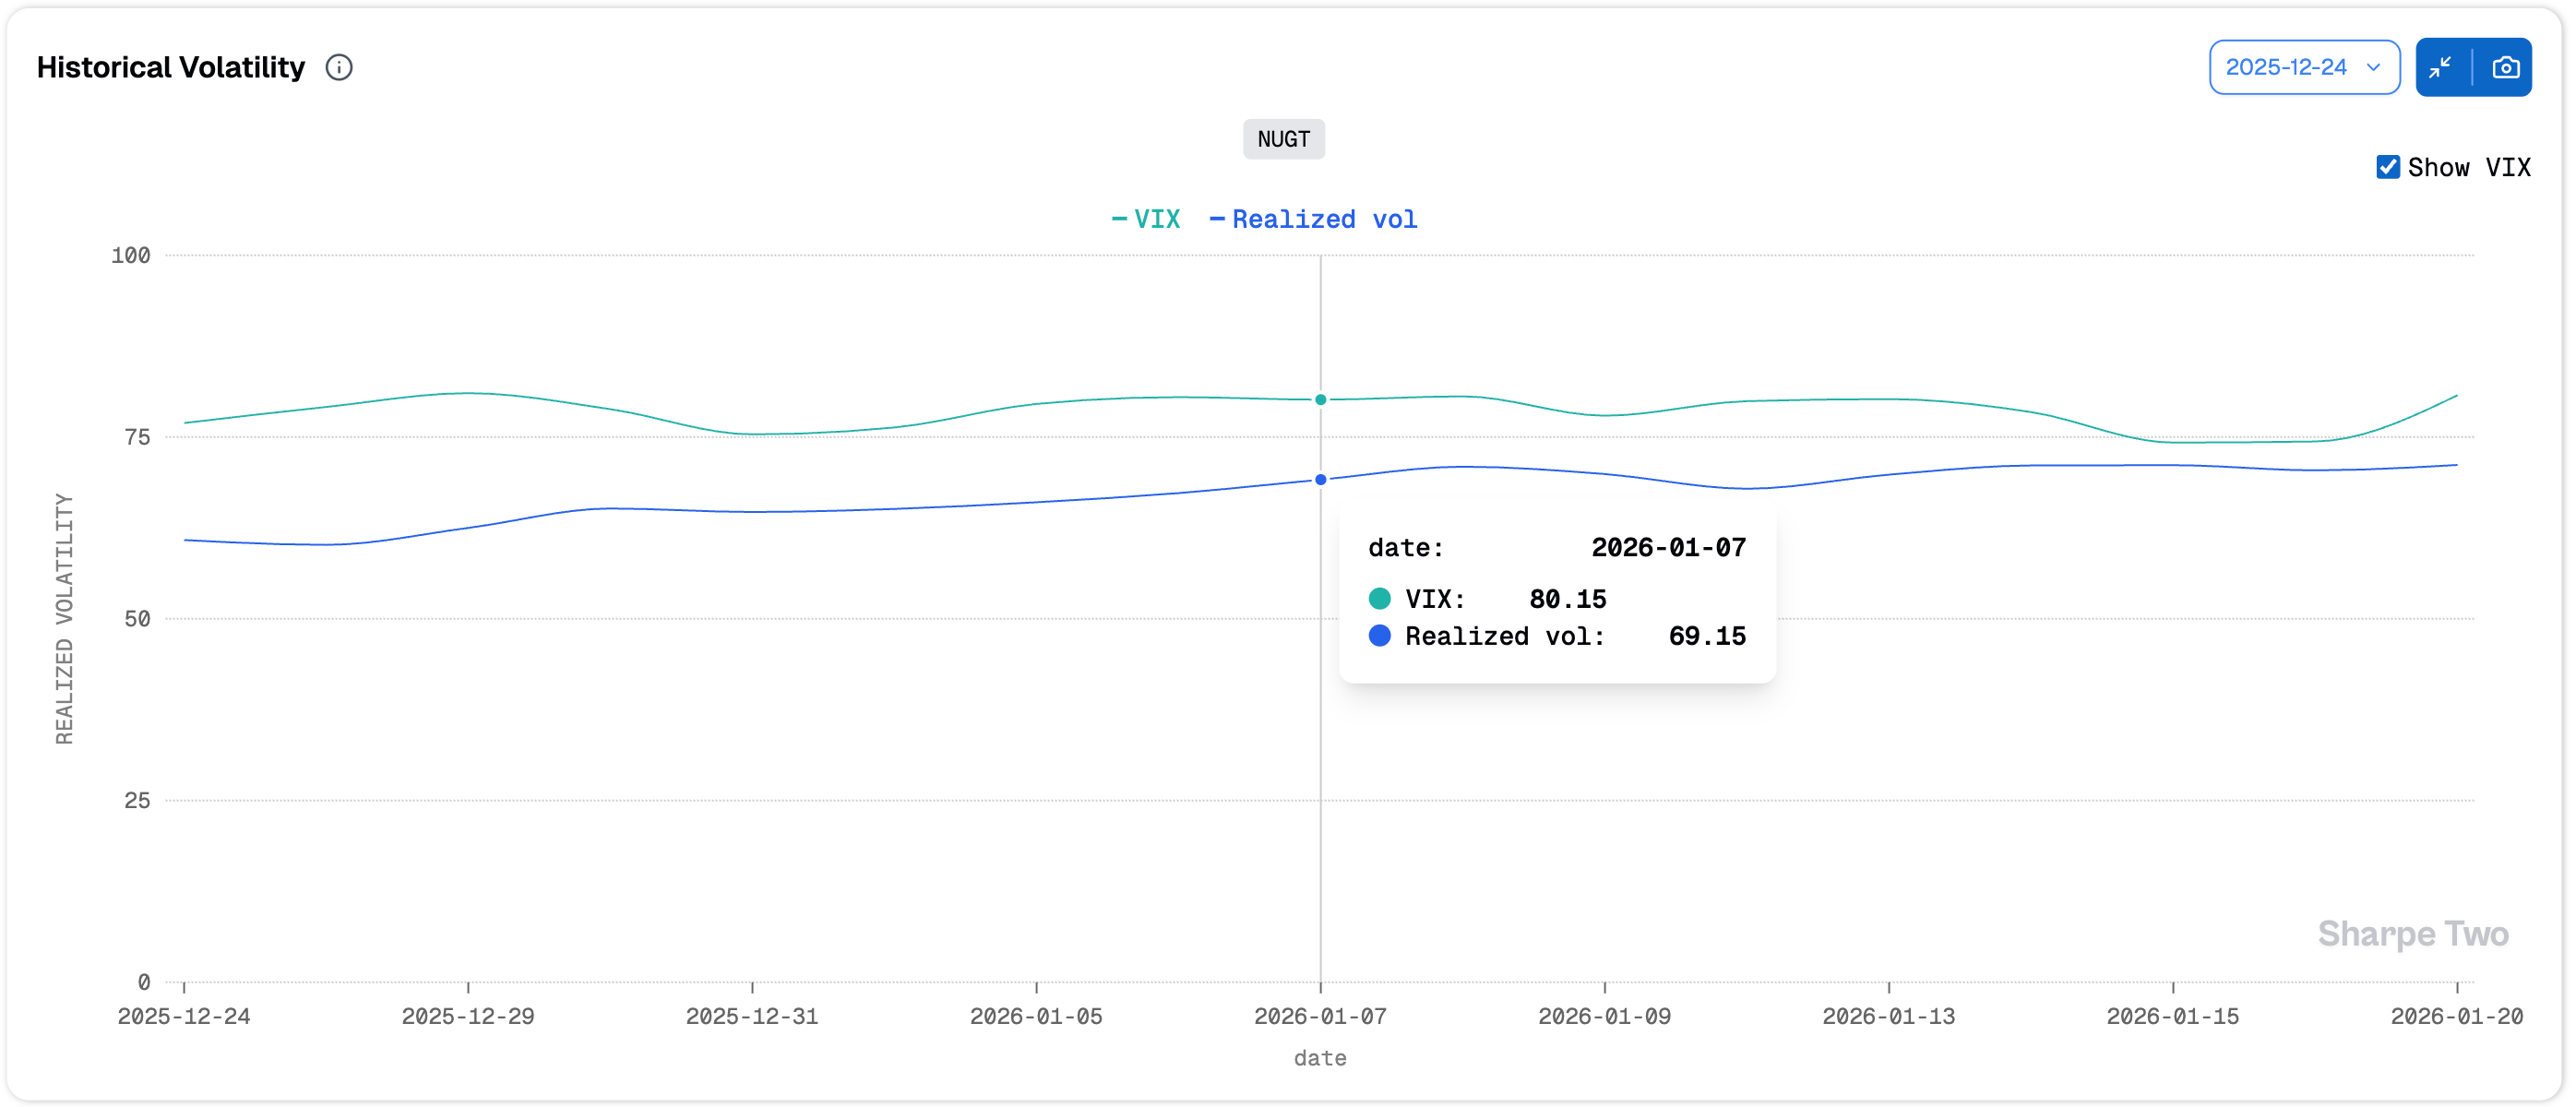
First, realized volatility did move higher over the period, rising from 69% to 71%. However, that alone isn’t enough to totally derail the thesis. Even with the realized volatility measure over the last two weeks sitting just below 74%, the spread we sold should have provided enough cushion.
While implied volatility softened for a time, it shot back up late last week and again yesterday, fueled by renewed tensions between the US and the EU. We expected IV contraction to act as a tailwind as our models forecasted a 64% probability of a volatility “cool-off.” Instead, after an initial dip from 80% to 74%, IV reversed course sharply to finish at 81%.
Let’s pause there: realized volatility rose slightly, but not enough to seriously challenge the 80% IV we sold. Meanwhile, terminal implied volatility ended roughly where we entered. These two factors combined still don’t fully justify the magnitude of the loss on this trade.
At this stage, there could be only one culprit: the path of the underlying and the lack of delta hedging.
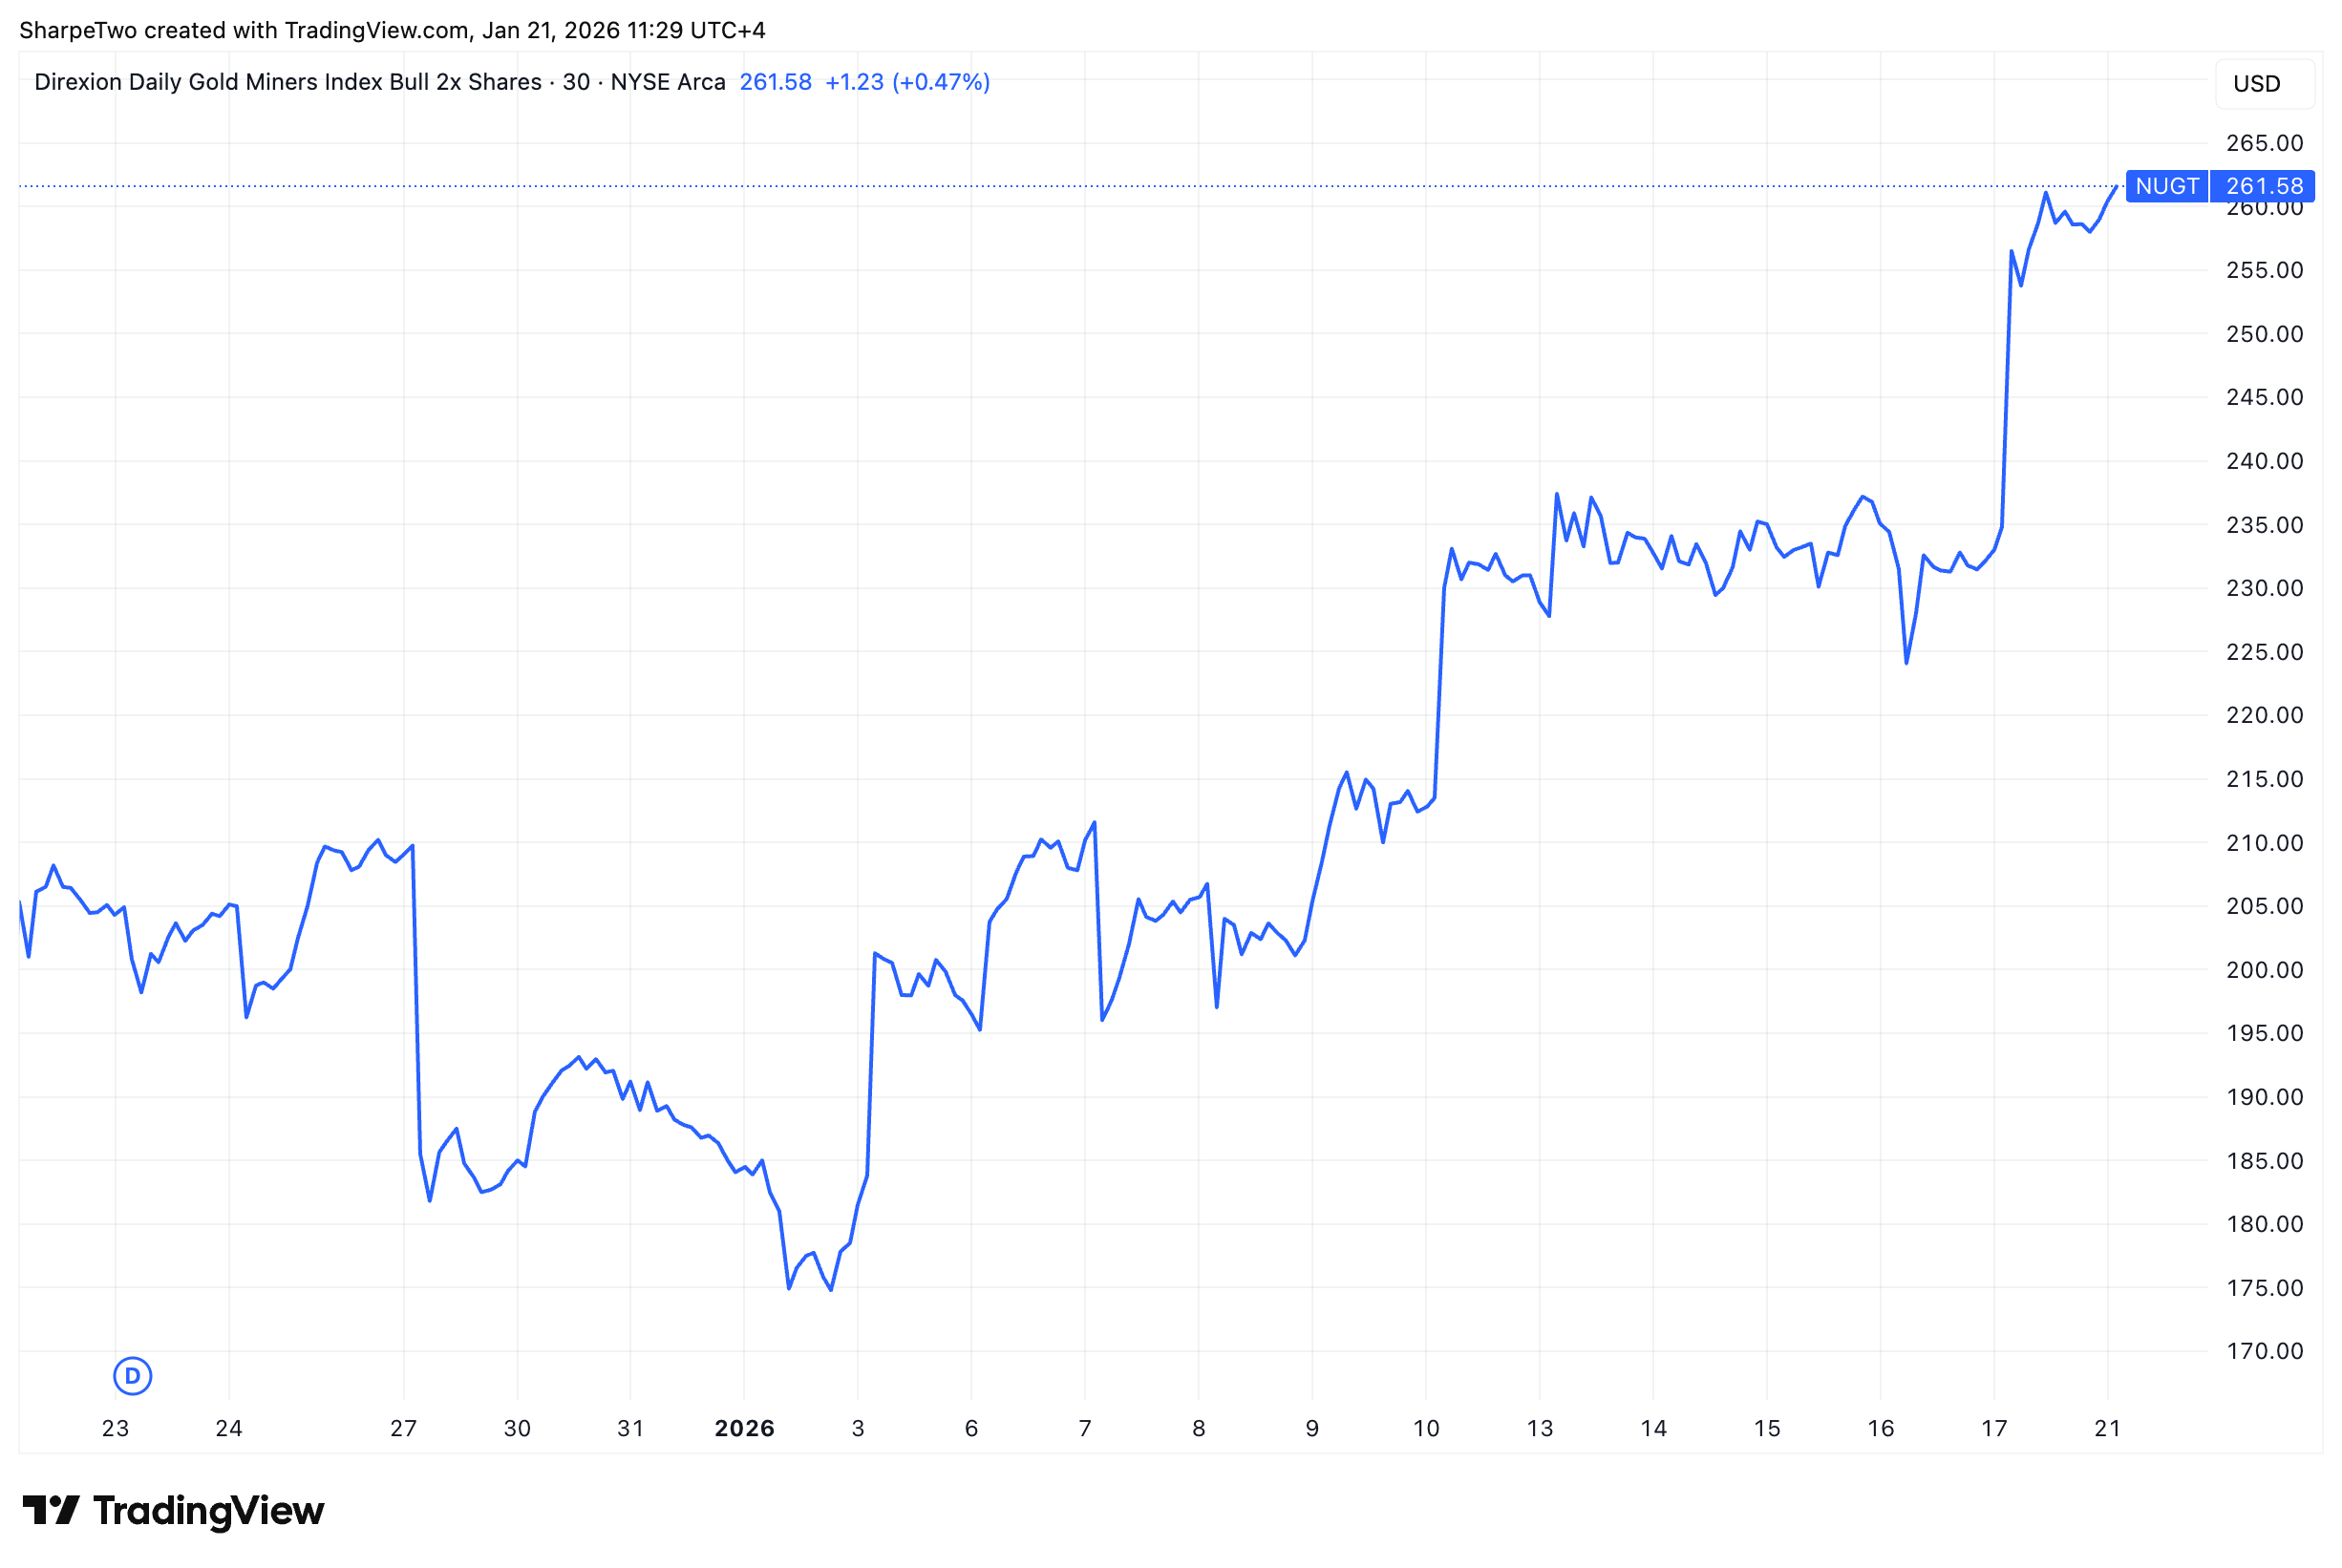
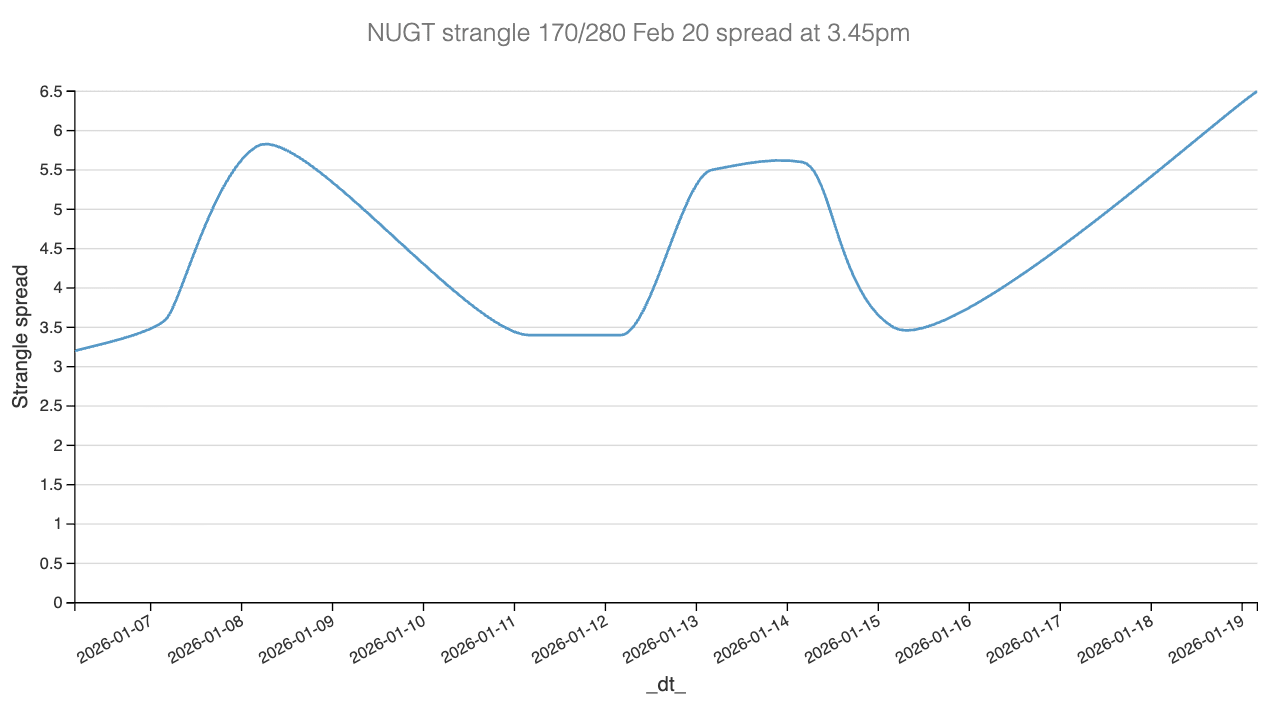
When we entered the trade, NUGT was trading near $205. It closed yesterday at $261.58. While a move of this magnitude is not entirely surprising for a 2x leveraged ETF tracking a hot sector, a 30% rally in a nearly straight line without delta hedging is almost guaranteed to be a death sentence for a short strangle. The PnL curve illustrates this clearly.
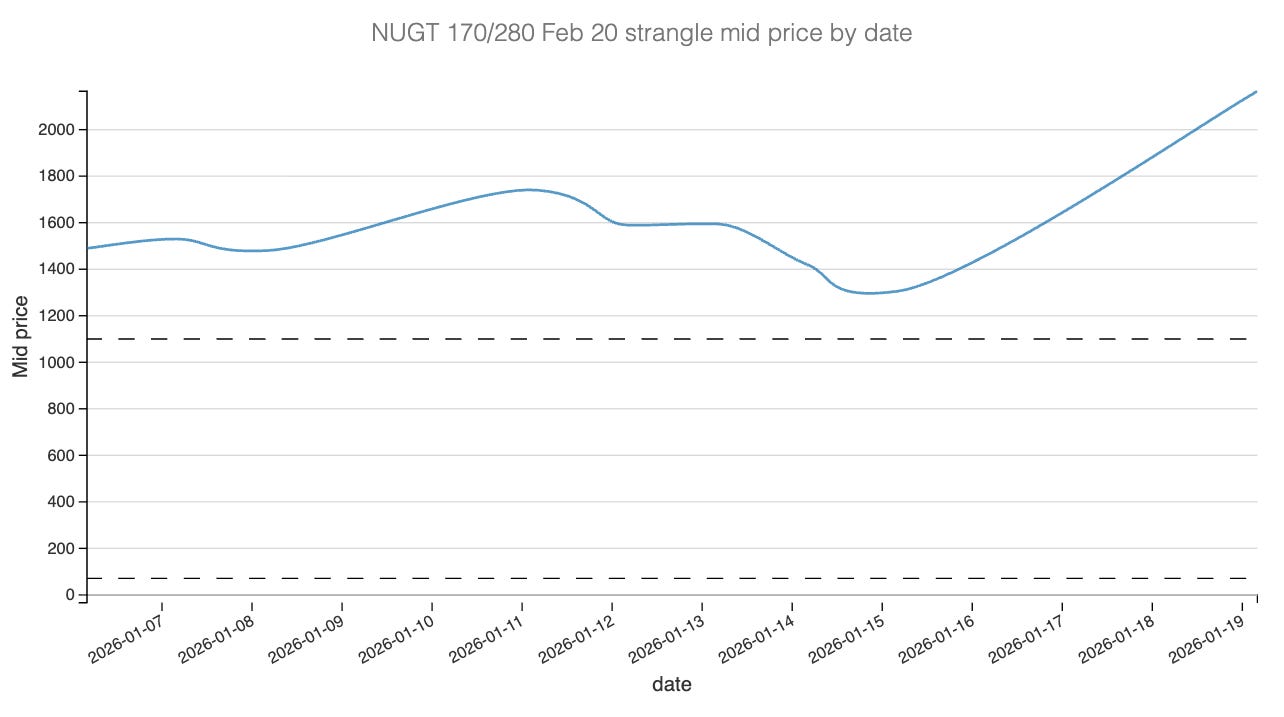
The trade struggled to find positive territory from the start. Although a brief dip in implied volatility late last week offered a glimmer of hope, the reprieve was short-lived. The renewal of US-EU tensions, the resulting “delta explosion,” and the subsequent spike in IV dragged the position deep into the red.
At this point, the temptation to hold the trade is immense. In fact, we recently had a lengthy discussion with a Discord member regarding the merits of keeping a losing position and waiting for mean reversion. We strongly advise against this, if the edge is not there anymore (more on that at the end of the article). Hoping for a “bounce back” at this stage is often no longer a volatility trade; it is simply a directional short position in NUGT in disguise.
There is a second, equally important lesson here regarding the bid-ask spread. The average spread in NUGT is quite wide, reinforcing the necessity of fighting for a favorable midpoint on both entry and exit.
With an average bid-ask spread of 4.5 points, this product is extremely expensive to trade. Crossing the spread alone would result in an immediate $450 loss per lot. To put that in perspective, that is nearly 2% of the $25,000 minimum required for the Pattern Day Trading rule, making NUGT a prohibitive contract for smaller accounts.
Beyond the execution cost, the sheer volatility is a major hurdle. With 70% realized volatility on a $250 stock, there is a statistical 5% chance of seeing a 4.5% move or $11 in a single day. While a strangle is designed to weather the storm, these PnL swings are often too violent for smaller account sizes to manage emotionally or financially.
Even for well-capitalized accounts, certain ground rules apply. For comparison, we successfully booked a profit shorting GLD over the same period, exiting just before the weekend. The problem? We sold premium on a product priced around $8, a fraction of NUGT’s cost despite both being in the precious metals sector.
While we primarily focus on signal generation rather than deep-diving into position sizing, we hope this case study encourages you to audit your own risk management rules. Every investor has a different tolerance, but in a product like NUGT, the math of the spread and the volatility cannot be ignored.
Let’s have a look at the in-depth Greek analysis now.
The Greek PnL Attribution
Analyzing the cumulative and daily PnL attribution confirms that this trade was not a failure of the volatility thesis, but rather a casualty of an aggressive, unhedged delta move.
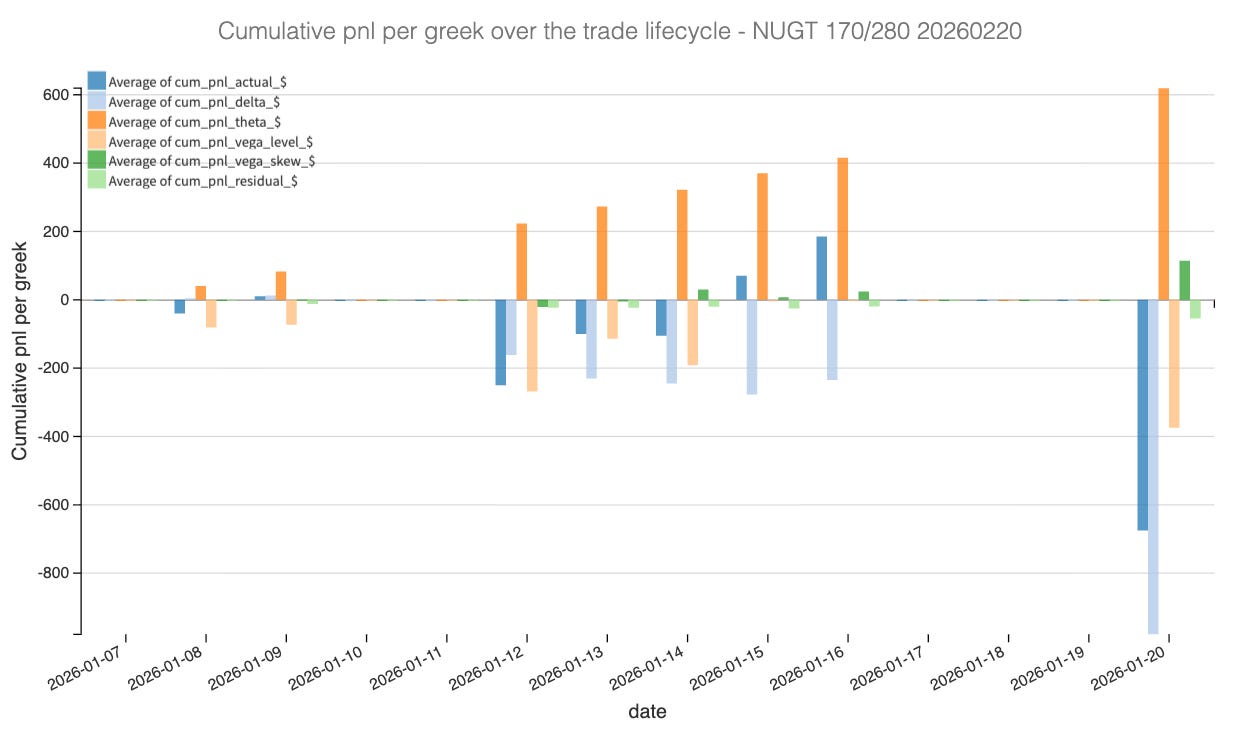
As NUGT rallied nearly 30% toward our 280 upper strike, the Delta PnL became the dominant driver of losses. The cumulative chart shows that while other greeks remained relatively stable, Delta PnL plummeted, ending the period at approximately -$800. This reflects the “death sentence” mentioned earlier: when an underlying moves in a straight line against a short strangle without mechanical delta hedging, the directional loss quickly overwhelms any premium collected.
Despite the directional headwind, Theta performed exactly as expected, contributing a steady cumulative gain of roughly +$600. This “rent” collection was the only thing keeping the trade’s head above water during the first week. However, the market’s refusal to let implied volatility (IV) cool off meant Vega provided no relief.
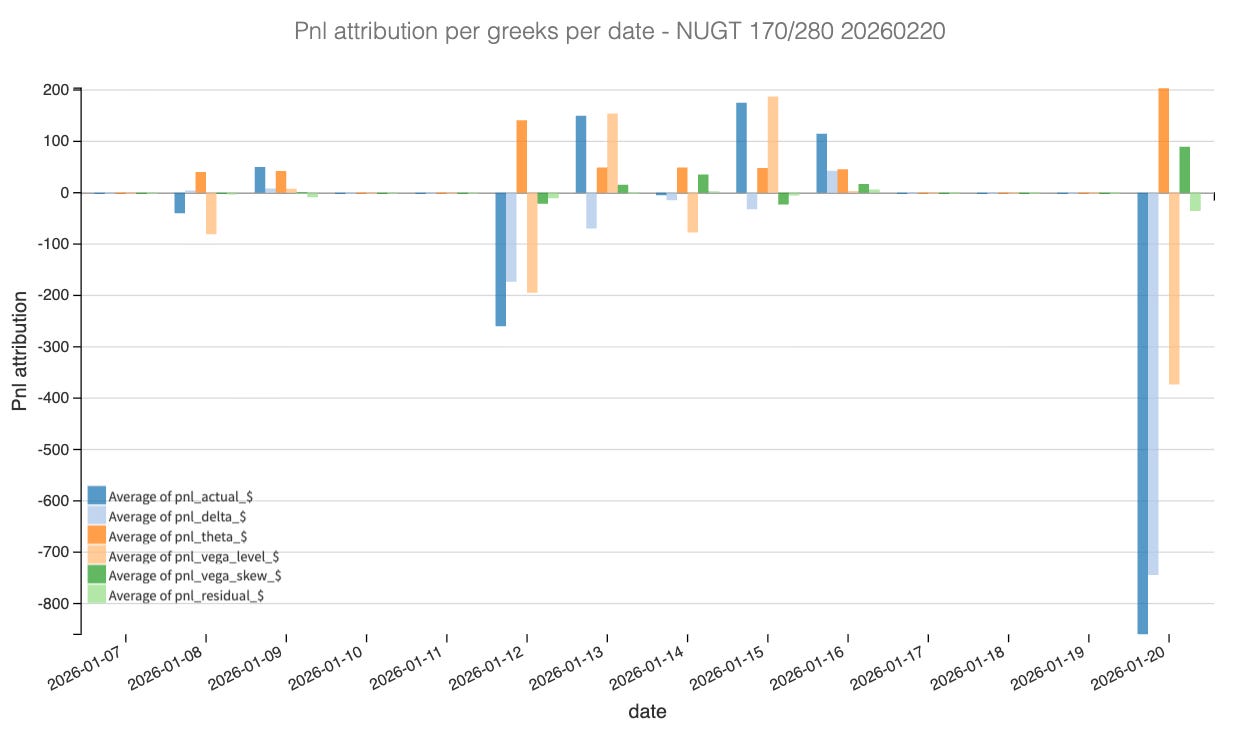
In the final days, as geopolitical tensions between the US and EU flared, we saw a sharp spike in IV. The daily attribution chart for January 20th shows a significant negative bar for Vega Level, indicating that the rise in IV (from 74 back to 81) actively stripped away the remaining PnL, coinciding with the final delta explosion.
The Residual PnL remained remarkably quiet, suggesting our model’s Greek approximations were accurate. Ultimately, the trade was a textbook example of Gamma risk in a high-volatility environment: the theta gains were simply not enough to offset the massive delta losses accrued during the vertical move to $261.
Now the last question to answer: should we recenter this position? We could consider a 210/320 strangle over the next two weeks for instance. Let’s have a look.
