
Trade Anatomy - Short Vol in KRE
Post mortem Signal Du Jour 20260211
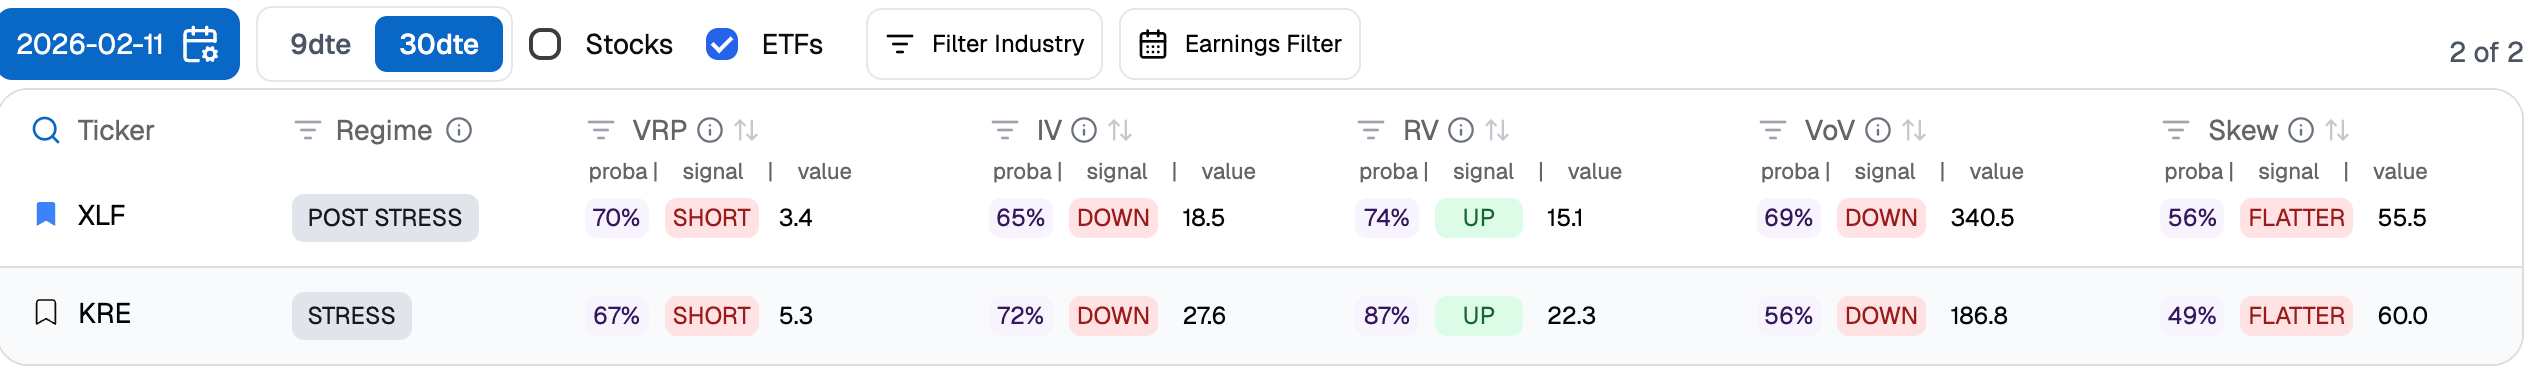
Two weeks ago we were highlighting an opportunity to short volatility in the regional bank index. We were at the time pointing to the favorable environment they seemed to operate in since the end of last year, carried by the prospect of potential lower rates by the end of the year.
As is often the case with the market, a thesis can turn quickly and KRE has been down quite a bit over the last few sessions, losing 8% since its peak of early February. What happened exactly? Apparently, the Fed may be a little bit more hawkish than anticipated — or so we read in the minutes — enough to give back most of the hard-acquired gains.
And with that, volatility went back up, yet not enough to stop us from posting another win for the year. We didn’t quite fully reach the profit target, but the relative stability in prices, and therefore lack of overall realized volatility made it a great environment for theta harvesting and ultimately showed a profitable position.
This is yet another good example of why we love volatility trading: you do not have to have an opinion on direction or a macroeconomic thesis. You must have an opinion on whether the cost of insurance — movement variability — in the underlying is high or not.
Another important point though: you must standardize your trade. We’ve had that conversation countless times since we started Sharpe Two and no longer than a few days ago, a reader complained that months of gains were erased by a bad signal in NUGT. It should be obvious that $3 of credit in a fairly stable product like KRE isn’t going to yield the profit needed to cover a loss in a $9 position in a highly volatile product. The most basic (and often enough) normalization you should do is to make sure that all your positions have the same size: you need to sell 3 KRE to withstand a position in NUGT. Or you can also not trade highly volatile products at all, especially if your account cannot handle the volatility in said product.
With that said, let’s have a look at our trade.
The trade
In our latest Signal du Jour, we were pointing to an opportunity to short the 68/74 strangle in KRE Mar 20 for about $3.31. The market had a big gap up on that day before turning violently in the red. We are not a hundred percent sure of the reason. “The market has been on edge lately” is an acceptable answer, sometimes. At that time though, we were pointing to high probabilities (67%) to see implied volatility exceed the subsequent realized volatility.
We were also convinced that implied volatility would ultimately go down from where it was and carry our trade positively, but at the same time, conscious that realized volatility could still bite. However, with more than 5 points of variance risk premium, this was enough to envision a trade. And like a few weeks ago, we ended up being slightly wrong on the implied volatility front.
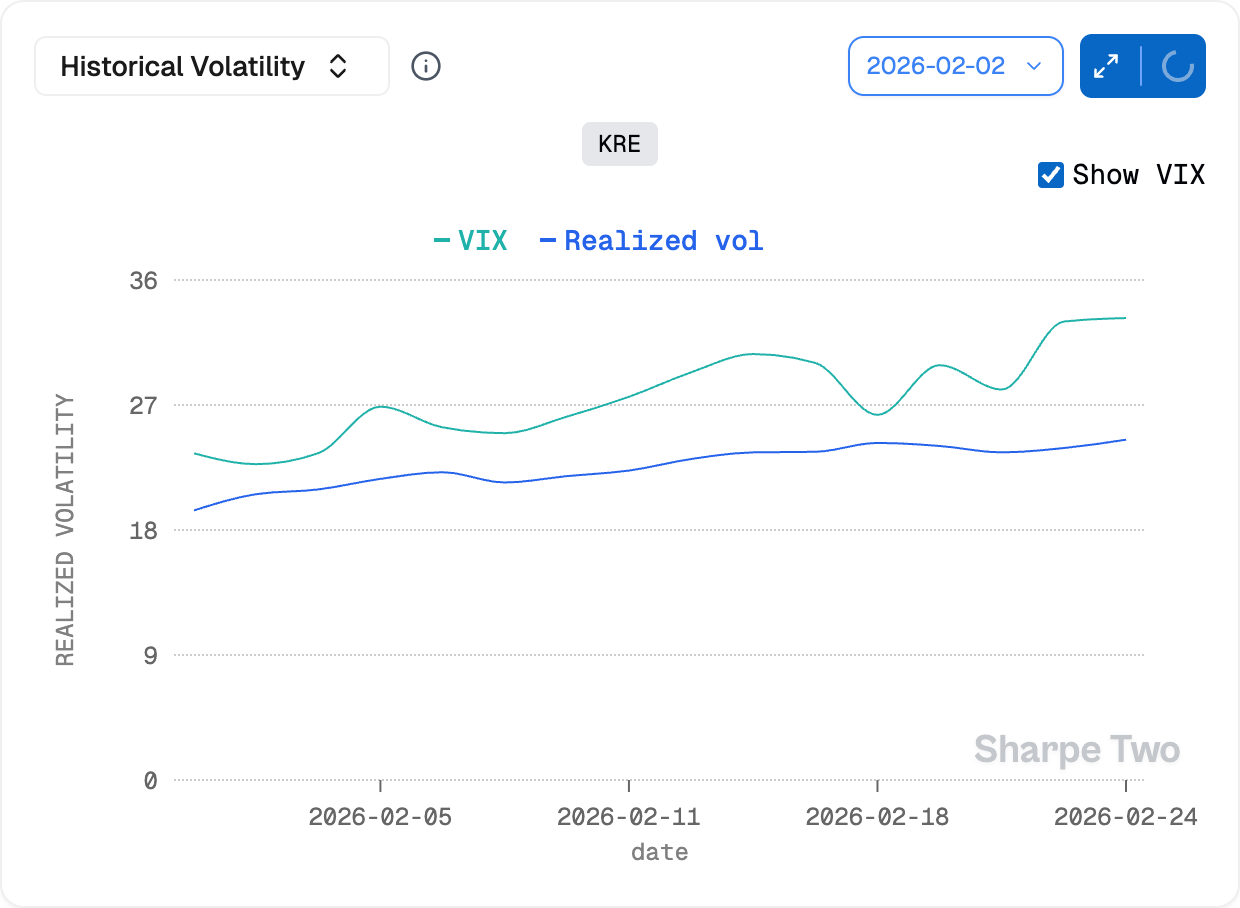
Implied volatility went up from 27.6 to 30.6, putting an initial drag on the performance. And if it ended up mean reverting a few days later, it was only to bounce back early this week. In the meantime, realized volatility took about 2 points, which is unlikely to have seriously challenged the revenue from time passing every day. However, this is not the only thing you want to control for: an increased realized volatility tends to push the underlying towards the strike of our position and delta can become a problem difficult to deal with.
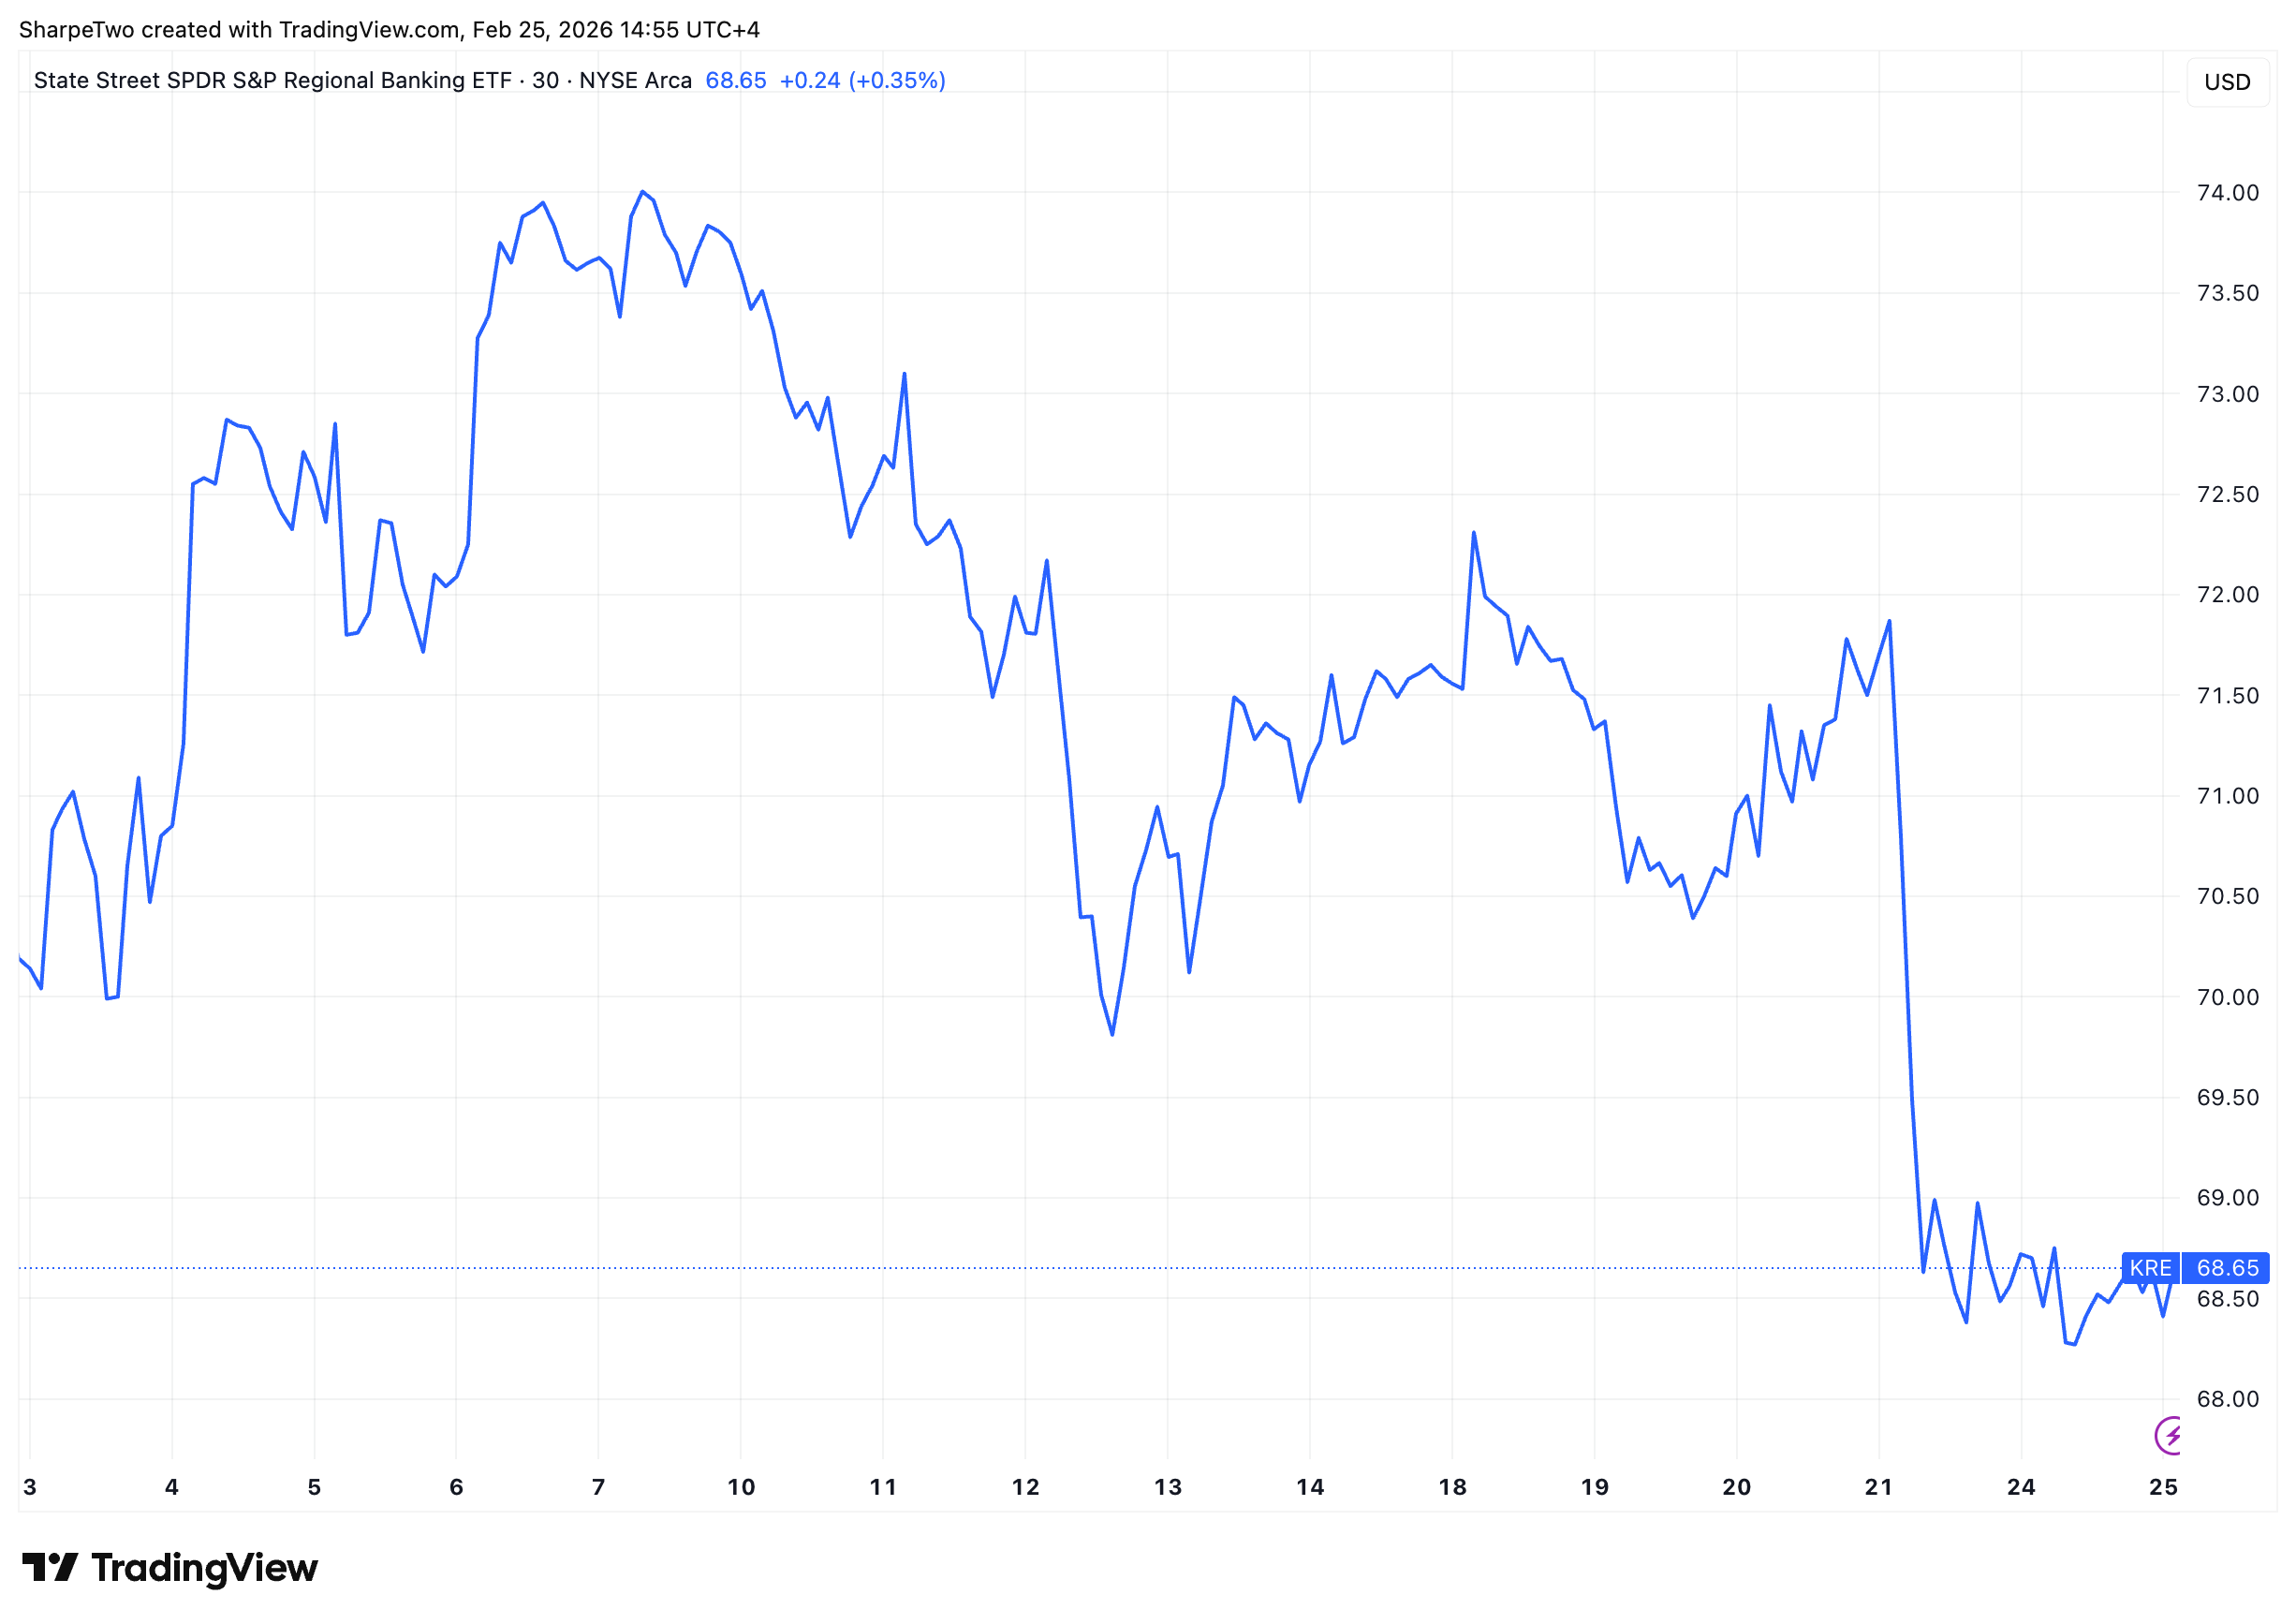
And while things were pretty much doing okay for most of the trade, the accentuated drawdown since early in the week would have for sure, taken some money out of our pockets. So where do we stand after two weeks in that position?
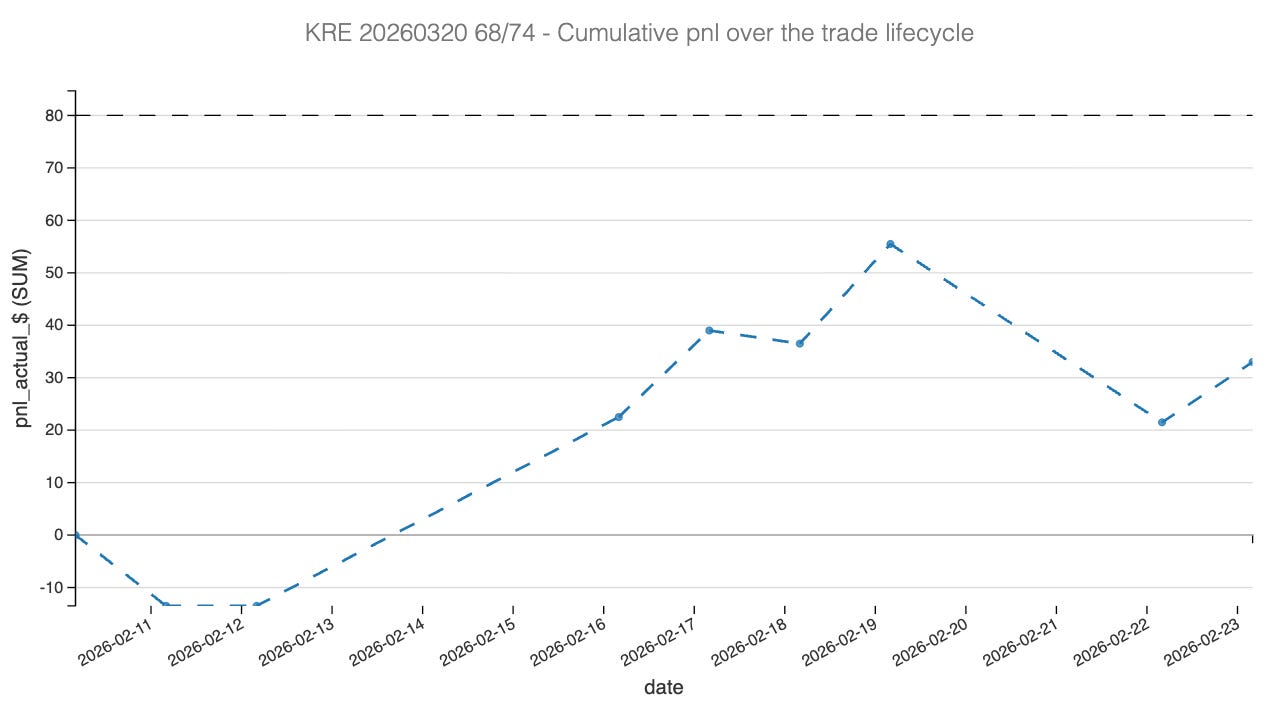
While the trade was never really offside, it never reached the 25% profit target either. It got closed at the close on Friday, but renewed pressure on the implied volatility front. and the move down has put us back at the 10% mark of credit received. We will take that, although there may be a question for later: should we still be in the position or not? But what to make of this? Good trade or bad trade?
On one hand, being wrong on implied volatility direction costs us dearly, but this is not what a variance risk premium trade is about: you are trying to capture the difference between the cost of insurance at the time of the trade and the realized variance. And in that sense, the trade behaved as we expected it to do. The fact that we didn’t reach the 25% target shouldn’t be considered a failure: this is a variance game and once in a while, you will have these slightly annoying “setbacks”. We’ll take them any day over a loss though.
Let’s now look at the PnL Greek attribution.
The Greek Attribution
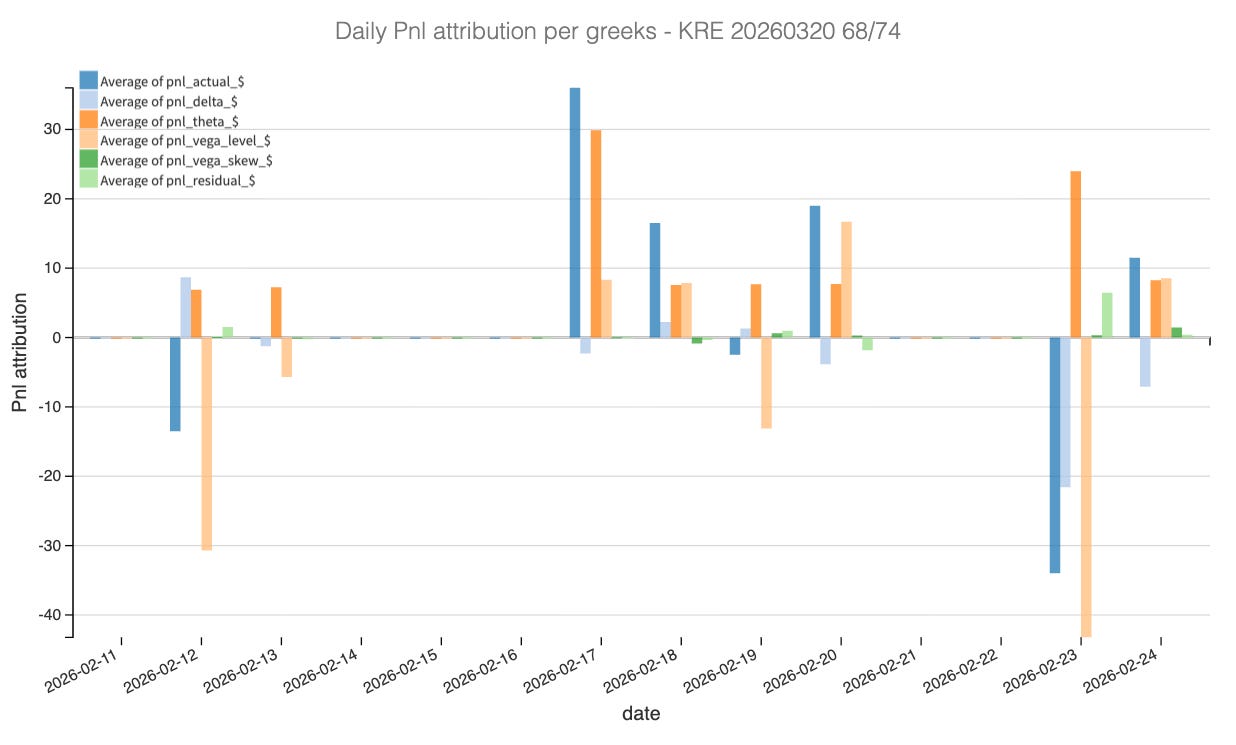
Looking at the cumulative PnL attribution, the story of this trade becomes immediately clear: it was a battle between the relentless accumulation of time decay and the headwinds of market direction and volatility expansion.
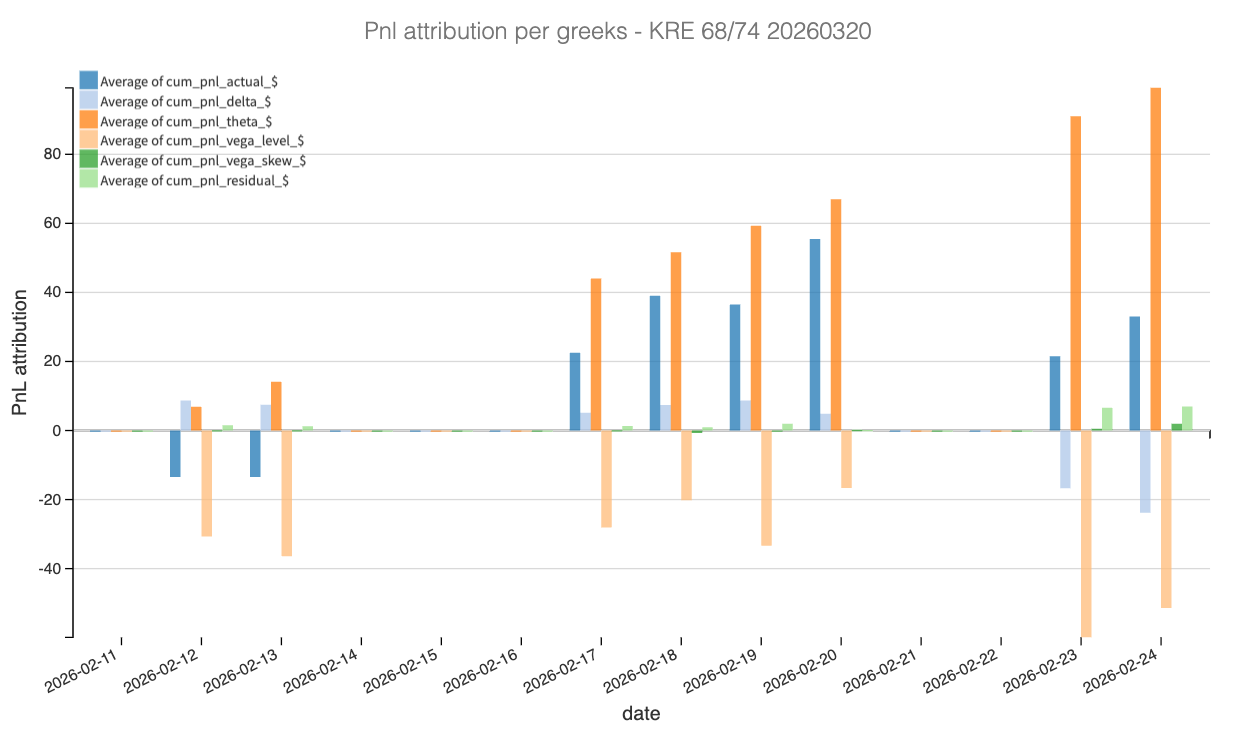
The hero of the trade is undeniably Theta (represented by the orange bars). From day one, theta provided a steady, upward trajectory in profit, confirming our initial thesis that the variance risk premium was rich. We sold the 68/74 strangle expecting the “cost of insurance” to be overpriced relative to the actual movement, and the massive positive contribution from theta validates that the market was indeed overpaying for protection. This income from time passing was the primary engine that kept the trade profitable despite other factors working against us.
Conversely, Vega (the light orange bars) acted as a persistent drag. As noted in the post-mortem, implied volatility drifted higher rather than reverting to the mean, moving from roughly 27% to over 30%. This negative vega attribution illustrates the cost of being “wrong” on the direction of implied volatility, which ate into roughly half of the gains provided by theta.
Finally, the delta component (light blue bars) highlights the directional stress mentioned earlier. While relatively mute for the first half of the trade, delta turned sharply negative around February 23rd. The daily PnL attribution chart isolates this moment perfectly: a significant drop in the stock price caused a spike in negative delta PnL, coinciding with the “renewed pressure” that forced the trade to close.
Ultimately, the fact that the actual PnL (dark blue) finished positive despite negative contributions from both Delta and Vega is a testament to the structural edge of the trade. The initial credit received of ~$3.1 provided enough of a buffer that even when direction and volatility went against us, the sheer weight of the variance risk premium allowed us to walk away with a win.
Now the important question: the trade hasn’t lost money, but should we keep it, or take our profit and move on to the next opportunity?
Let’s have a look
