The VIX is broken. Really?
Supply-demand, correlation-causation, and new market regime.
The VIX index is, without a doubt, the go-to barometer for equity market sentiment.
Often dubbed the 'fear gauge,' the VIX reflects the demand for out-of-the-money options on the S&P 500. There's a widely held belief that a rising VIX signals a drop in equities – and while there's some truth to this, it's not the full story.
Relying solely on this assumption can lead to costly missteps.
A common pitfall is the expectation of market downturns simply because the VIX is up or anticipating a surge in the VIX during market downtrends.
And each time the VIX deviates from their expectations, a chorus of claims emerge: 'The VIX is broken' or 'Market Makers are manipulating the VIX.'
Spoiler alert: the market isn't rigged.
However, the VIX often seems like an enigma to those who haven't invested the time to understand its nuances.
Let’s dig in.
Some math (without math)
The VIX, calculated by the CBOE, isn't just a number pulled out of thin air. It's an index derived from a strip of Out of The Money (OTM) options in the S&P500 —both puts and calls. By interpolating the options set to expire in about 30 days, the VIX provides a handy gauge of market sentiment as to what to expect in the next … 30 days. The exact formula is readily available for those who want to explore the equations.
A side note: While we steer clear of dense mathematical discussions in our newsletter, we encourage curious readers to explore further. Don't be intimidated by the math behind the VIX. It's actually not as complex as it seems, and with tools like ChatGPT, you can easily break it down step by step.
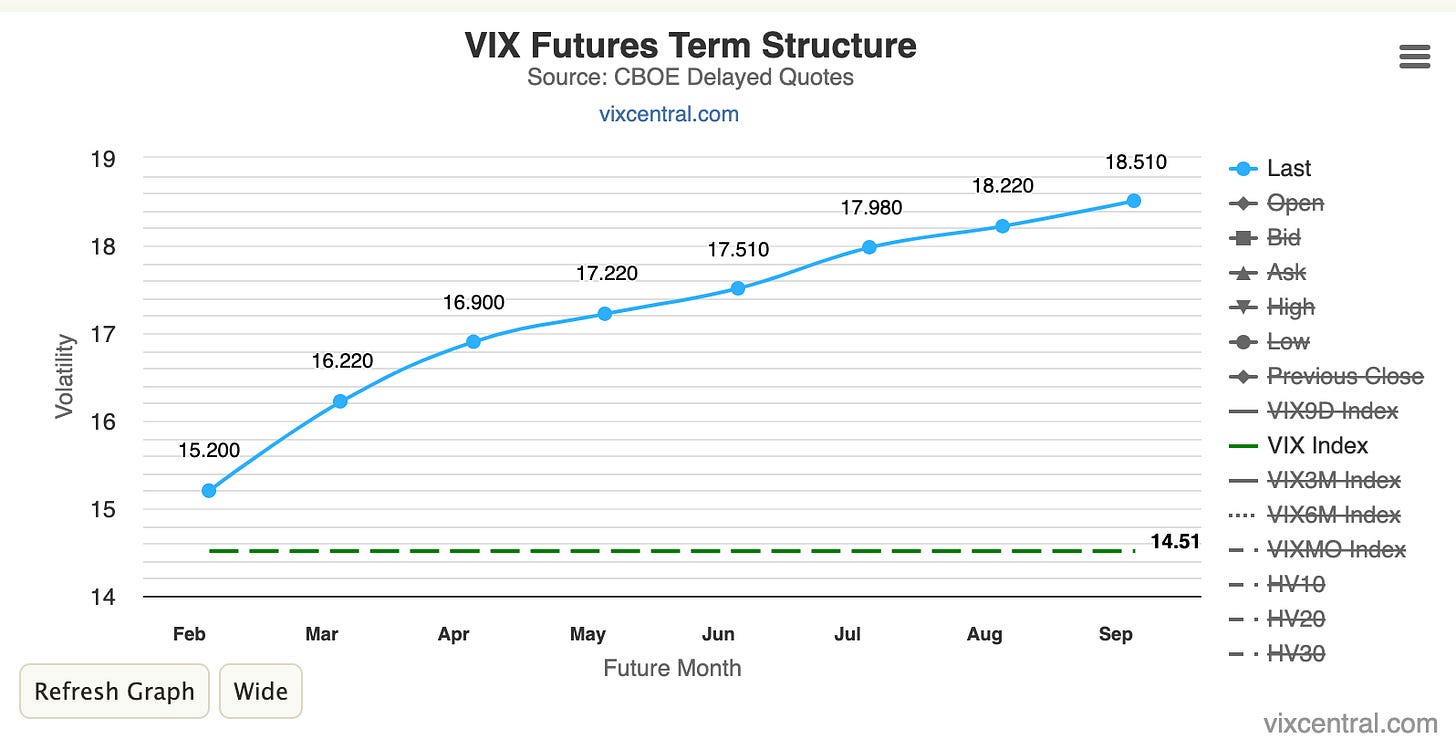
The CBOE uses the same methodology to compute various other VIX indices, although less well-known among retail traders. These include VIX9D (using options expiring in 9 days), VIX3M (3 months), VIX6M, and VIX1Y. In this context, the standard VIX could actually be termed VIX30D or VIX1M. Recently, catering to the growing interest in zero days to expiration options (0 DTE), the CBOE has even introduced a VIX1D. With all these indices available, savvy investors would do well to monitor the VIX term structure to better understand the prevailing market regime - contango, RAS, flat, there is some nervousness in the market, or backwardation signals a crisis.
While revisiting the VIX calculation, it's crucial to understand that every out-of-the-money (OTM) option, both puts and calls contributes to the final reading. Additionally, puts and calls that are equidistant in terms of distance from the current at-the-money (ATM) strike receive equal weighting. This method ensures the VIX remains contract-neutral without inherently favoring puts over calls.
However, if puts aren't given precedence in the VIX equation, why then does the VIX typically spike during market downturns rather than during rallies?
The key lies in the dynamics of supply and demand in the options market.
A story of supply and demand
Generally, puts are in higher demand than calls across various market conditions. This demand is not constant but varies according to the prevailing market regime; on average, it hovers around a ratio of 1.3 for the SP&500.
Let that sink in for a minute.
Now, imagine a world where market participants behaved with perfect rationality and where the fear of catastrophic losses didn't exist. In such a scenario, puts would lose much of their appeal, and the put-call ratio would likely hover much closer to 1.
Yet, the reality is that the market, while not entirely rational, isn't completely illogical either.
Consider this thought: 'If a black swan event hits the market tomorrow, I need to ensure I can sell my stocks at a decent price. I'm willing to pay a premium for that advantage.' It's akin to having home insurance; on the surface, it might not seem like a great deal, but in the event of a major earthquake, it becomes invaluable.
This tendency to prioritize protection, even at a higher cost, is what fundamentally distorts the pricing on the put side, reflecting a collective sentiment deeply rooted in the market psyche since the crash of 1987.
Why don't we see a similar premium on calls as we do with puts? The answer lies in their utility, or lack thereof, for fund managers. When fund managers are already long on stocks, they simply don't need additional insurance for them.
This fundamental difference in utility is why we see the well-known volatility smirk in equity indices. As you move further out of the money, the implied volatility tends to increase for puts as a result of price distortion from demand, but not necessarily for calls.
And that's really all there is to it.

Correlation, yes. But causation?
Understanding the impact of supply and demand on put prices helps explain why the VIX often spikes amidst market nervosity. But for fund managers, buying 'expensive' protection is not just a precaution; it's often a contractual obligation they owe to their clients.
Here's where misconceptions arise for retail traders.
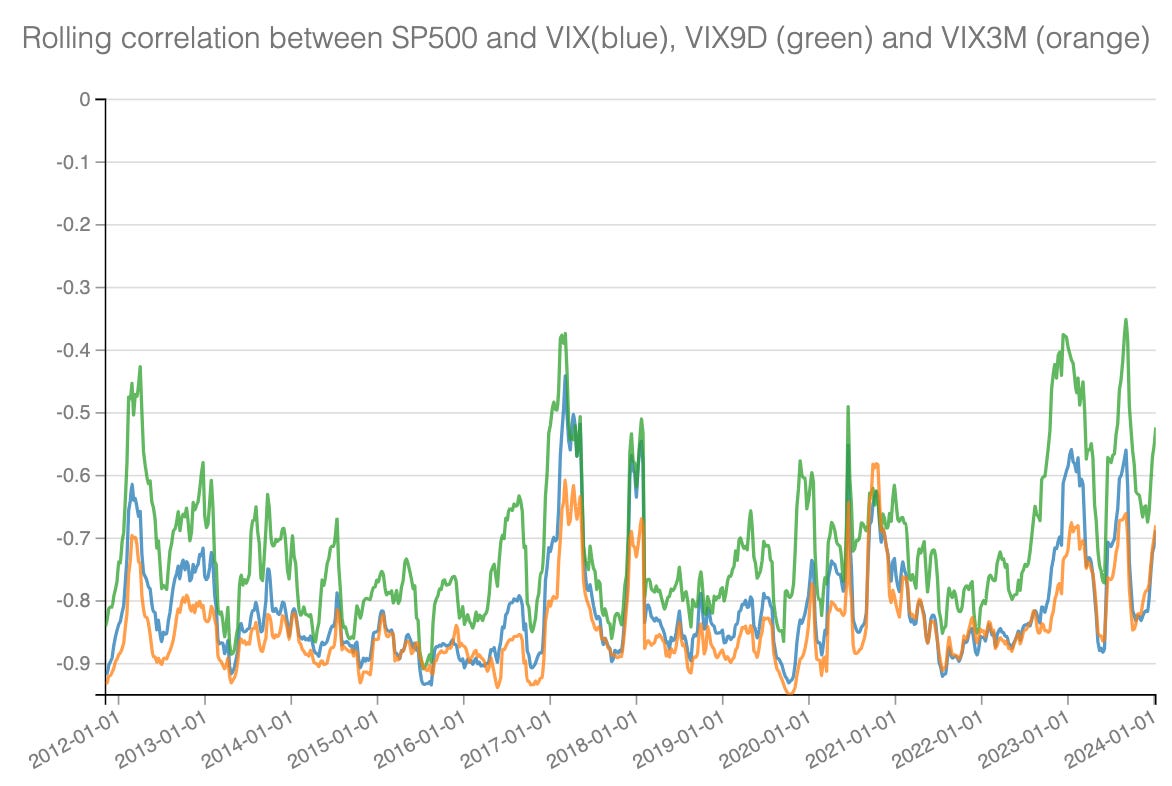
Despite the well-known negative correlation observed on the plot, buying options for protection doesn't always correlate with immediate downward movements in the S&P 500.
It's quite common for volatility to increase in anticipation of significant events while the market itself remains relatively static. Conversely, it's not unusual to witness a rally coinciding with a rise in the VIX, particularly if the demand for calls outstrips the pace at which puts are being sold off.
These instances occur more frequently than one might expect, underscoring the correlation between VIX and SP500, but not a direct causation.
Another side note: Yes, there are instances where causality effects come into play. Predictable hedge flows, due to their reflexivity, can influence the underlying market to some extent. However, the importance of these gamma flows has been overstated in recent discussions. Gamma, much like theta, doesn't confer a trading edge. We've observed too many retail traders getting lost in these complex metrics, often to their detriment. We advocate a return to simpler, more fundamental concepts as a more reliable basis for decision-making.
Still not entirely convinced about the weak causal relationship between the VIX and market movements? Let’s consider this scenario: what if all fund managers suddenly cease buying protection, even as the indices continue to decline? In such a case, what would be the impact on the VIX index?
According to the CBOE's methodology, the VIX wouldn't experience any significant change. This isn't mere speculation; it's a mathematical certainty. Without further price distortion caused by a surge in demand, the VIX reading would remain static.
A concrete example
Rewind to October 2022, a period marked by widespread frustration with the VIX. Market commentators lamented that the VIX wasn't fulfilling its perceived role.
“If you don't rise up to the occasions, VIX, you're not doing your job. You might as well be fired!” could have said Rick Santelli in a fictional interview with the VIX itself on CNBC.
“No one's buying additional protection, Rick. Without additional demand, I can't escalate. It is beyond my pay grade. Sorry, pal!” would have answered the VIX on live TV.
At that time, the VIX was hovering in the 30s, a level already indicating significant market tension. Yet, the prevailing sentiment was that it should have been soaring towards 50 or even higher.
Why?
The expectation was that it should mirror the wild swings in the S&P 500 - there were some wild moves in October 2022, we give you that and the 200 points rally in a day on 2022/10/13 still give us some cold sweat.
But such views betray a fundamental misunderstanding of the VIX's true nature. If the VIX remained steady despite the market's convulsions, it suggested a lack of demand for additional protection among professional investors.
Why didn't demand increase, though, when the world was seemingly on the verge of collapse?
In October 2022, while media outlets like CNBC, the Financial Times, Twitter, and Reddit were in a frenzy, fund managers — backed by teams of cool-headed professionals — were assessing the situation based on hard facts. Their primary concern was determining the value of buying more protection when the VIX, already at 30, indicated that such insurance was becoming prohibitively expensive. And their conclusion was it wasn’t worth it.
Let's consider a 'retail' example to illustrate this point: from 2009 to 2015, we purchased every new iPhone iteration. But then we stopped. Why? Simply put, price sensitivity: the cost became prohibitively high, even for our own irrational gadget love. We couldn't justify spending another $1,000 on a smartphone when the new features didn't match the increase in price. The alternative? Stick with the phone we already had.
This same principle of price sensitivity applies to market participants during times of financial tension: in October 2022, the features of a 30 DTE put, didn't justify its astronomical price in the eyes of fund managers. So they stayed on the sideline, and the VIX stalled.
A new market regime?
Recently, we came across many analyses suggesting that the advent of 0 DTE options significantly altered market dynamics for options, thereby affecting the VIX. Understanding the VIX's calculation methodology lends some credence to this hypothesis: if the majority of trading volume is now concentrated within a 0 to 21-day window, it's plausible that the price distortion traditionally observed around the 30-day mark might shift closer, say, to around 9 days.
A glance at a chart showing the correlation between VIX returns and S&P 500 returns seems to confirm a notable shift around October 2022, coinciding with the rise of 0DTE options.
However, we approach this theory with a degree of skepticism. If this was accurate, VIX9D should exhibit its own unique market dynamics, somewhat detached from the broader VIX term structure.
Yet, our observations don't support this. The correlation between VIX9D and the other VIX indices remains high. Furthermore, the entire VIX term structure hasn't demonstrated any significant new dynamics since the introduction of 0DTE options.
As we navigate the current market landscape, we're inclined toward a simpler explanation. Perhaps we're simply in a new market regime, reminiscent of the period around 2012 and 2013 when the correlation between S&P 500 and VIX returns dipped to around 70%. That period was also marked by influential monetary policies.
It's not far-fetched to consider that the rapid pace of recent interest rate hikes has set off a chain reaction, still being assimilated by the market. One consequence of this adjustment could be a growing disconnection between the SPX and the VIX, similar to the disconnection observed between bonds and stocks.
It's entirely plausible that, in three to five years, economists and quantitative analysts will retrospectively classify this time as a distinctive market regime characterized by an extreme shift in monetary policy.
Only time will provide the full story.
For now, it's prudent to avoid rashly concluding that the VIX is 'broken.'
Be sure to follow us on Twitter @Sharpe__Two for more of our insights. If our work resonates with you, don't hesitate to share it with others who might find it helpful.


