Signal Du Jour - Short vol in XLU
Targeting more stable sectors.
Although we generally don't pay too much attention to it, we've entered the first quarter's expiration week. This, coupled with the slight nervousness that emerged at the end of last week and the CPI data expected this morning, has the potential to bring both realized and implied volatility back to the forefront of the marketplace conversation.
As a volatility seller, your goal is to manage this risk. You can either add tactical long positions (preferably with an edge), or you can decide to keep shorting volatility while targeting asset classes that should be less reactive than others.
With that in mind, today we look into XLU, the ETF that provides exposure to the Utilities sector. While it won't be immune to any strong reactions in the main indices, as a traditionally defensive sector, it will most likely react significantly less than QQQ or SMH.
Let's have a look.
The context
Traditionally, the utilities sector is where the market's ebbs and flows are better absorbed. Whether there is inflation, an economic crisis, or a tech bubble, people still have to pay their utility bills. Governments often closely regulate the sector to ensure that energy/water bills don't exceed a certain threshold. As a result, the cash flows in these organizations are very predictable, and surprises are rare.
When you add the basket effect to this, volatility is often dampened.
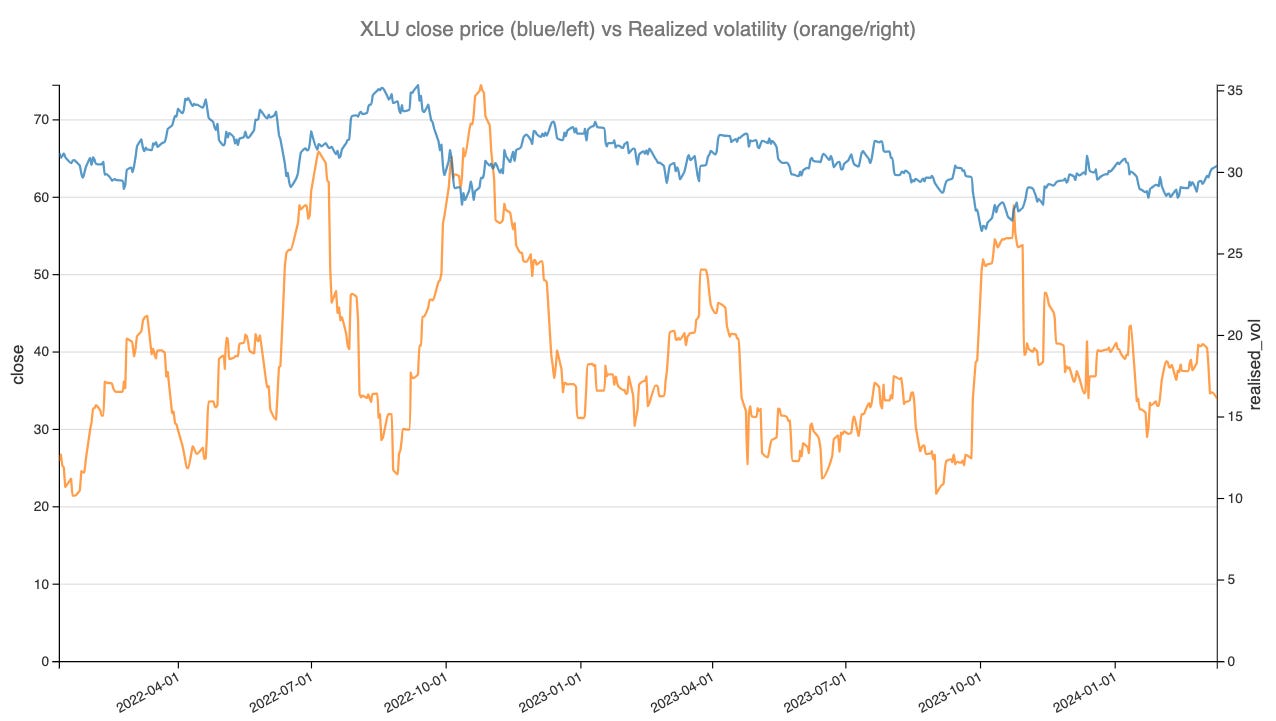
As you can see, XLU has fluctuated within a narrow range between 60 and 70 over the past two years. Despite some volatility spikes in 2022 and 2023, when the conversation around inflation was heated, these fluctuations had little in common with other asset classes that were much more reactive to changes in monetary policy. We naturally think of the tech sector, full of unprofitable companies whose valuations were slashed as interest rates rose, impacting the discounted cash flow formula used to determine their fair value.
Now that we've put XLU in context let's look at the current level of implied volatility in its options complex. To do this, we will, as usual, examine a reconstruction of the VIX index for XLU using the CBOE methodology and 30-day options prices.
Throughout January and February, options prices have risen to some of the highest levels observed in the last 12 months. With the current implied volatility sitting at 30.35 and realized volatility below 22, some attractive opportunities for volatility sellers have emerged.
Let's dive into the data.
The data and the trade methodology
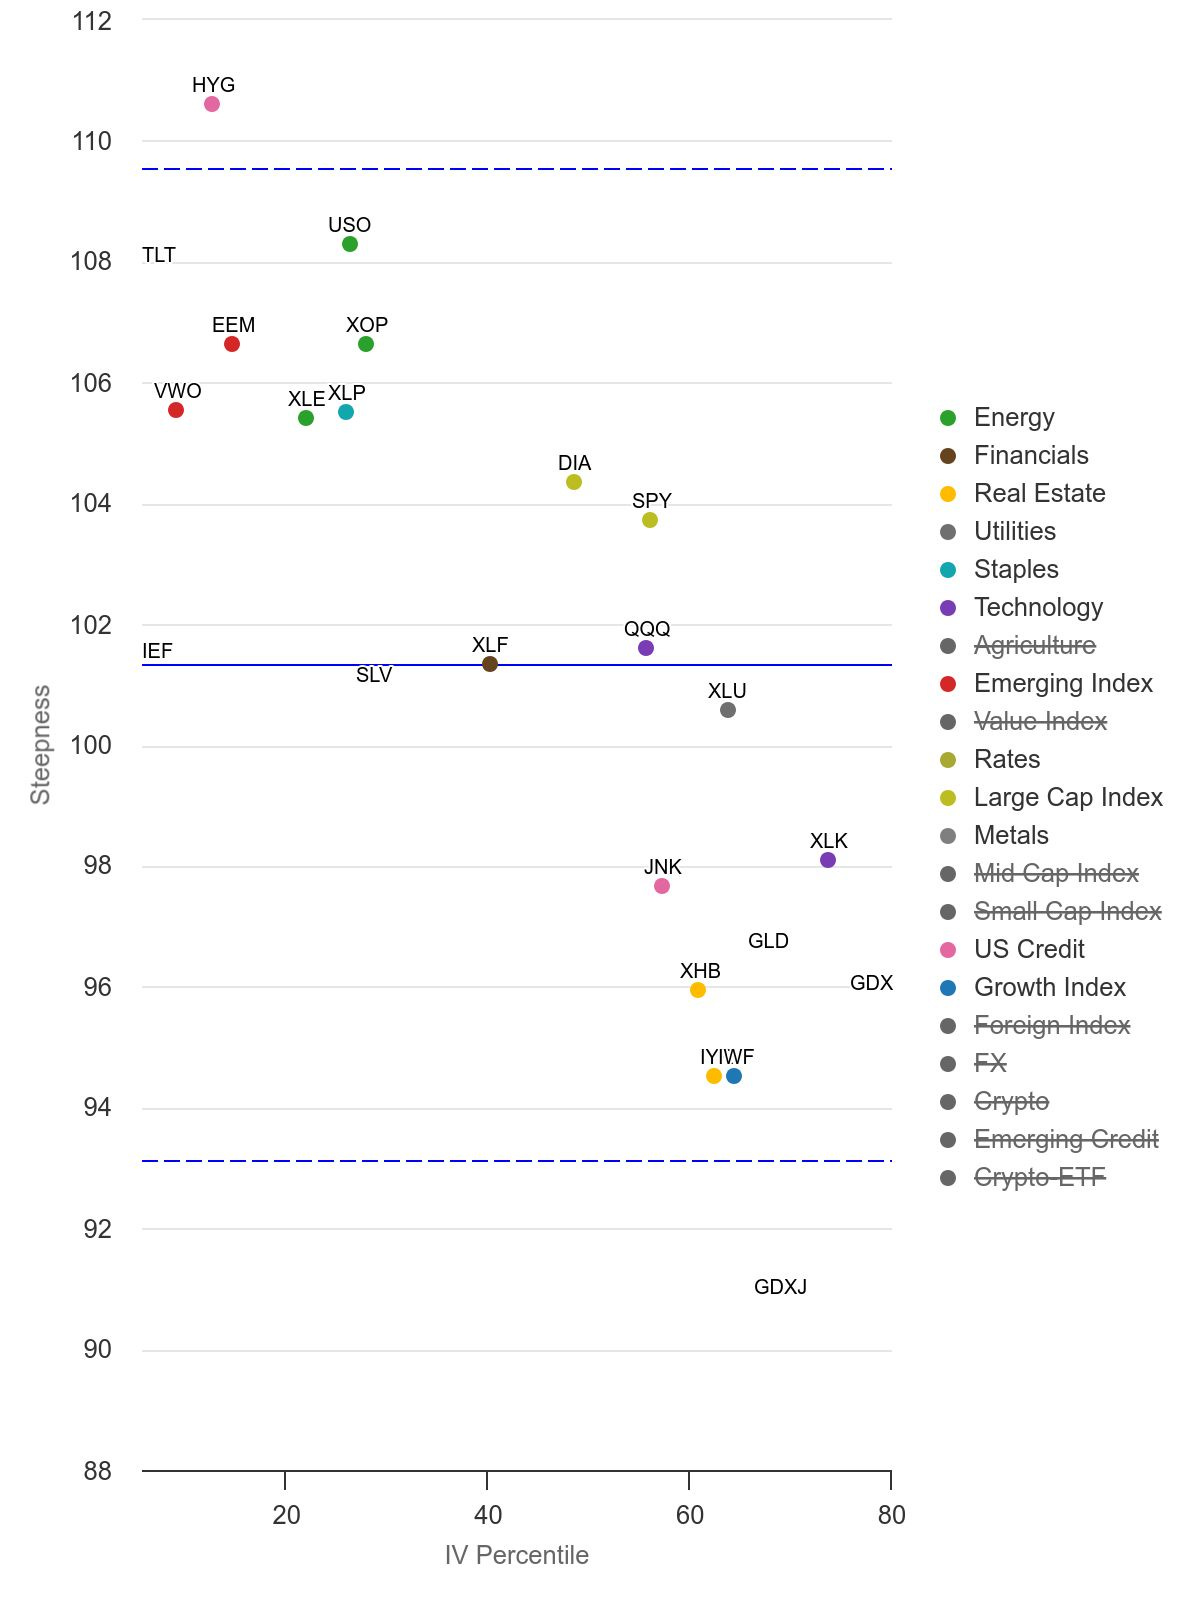
We will begin this section by using a chart from our friends at Moontower.ai to put the steepness of the curve and the price of options into perspective.
This chart provides some crucial insights about XLU at the moment. While we won't be surprised to see an elevated level of volatility, as demonstrated by the IV percentile and in line with our observations from the previous section, we can also see that the steepness is not particularly pronounced.
We wrote about sliding the implied volatility curve to capture the premium a few weeks ago. We noted that while a completely backwardation curve was often detrimental to short sellers, a regime where the implied curve transitioned from backwardation to flat was often great.


