
Signal du Jour - short vol in NUGT
Let's take advantage of the rally in gold
While we wait for CPI—the last big number before next week’s FOMC—the PPI print yesterday showed prices slowing much faster than expected. Stocks initially cheered, but once again failed to make meaningful all-time highs. The worry is shifting to the job market: if prices are not rising, maybe it is because people are not as employed as we thought. Not an absurd hypothesis, given the 900k downward revision in jobs over 2024.
We will see how that story develops in the weeks ahead. In the meantime, we need to line up another trade. Well—need is a strong word. If the odds are not there, do not force the shot. But when you do have solid data at your fingertips, finding good ideas outside your usual playground has never been easier. (Don’t forget to review how the trade from two weeks ago played out.)
This week, the spotlight is on NUGT, the ETF giving leveraged exposure to mining companies.
Let’s take a look.
The context
Gold has been on a wild bull run this year—though, to be fair, the story stretches back a decade. We remember trading it around $1,200 in 2012. Seeing it now at three times that price is dazzling. Yet the drivers remain familiar: looser monetary policy on the horizon and a healthy geopolitical premium have kept the precious metal front and center in 2025.
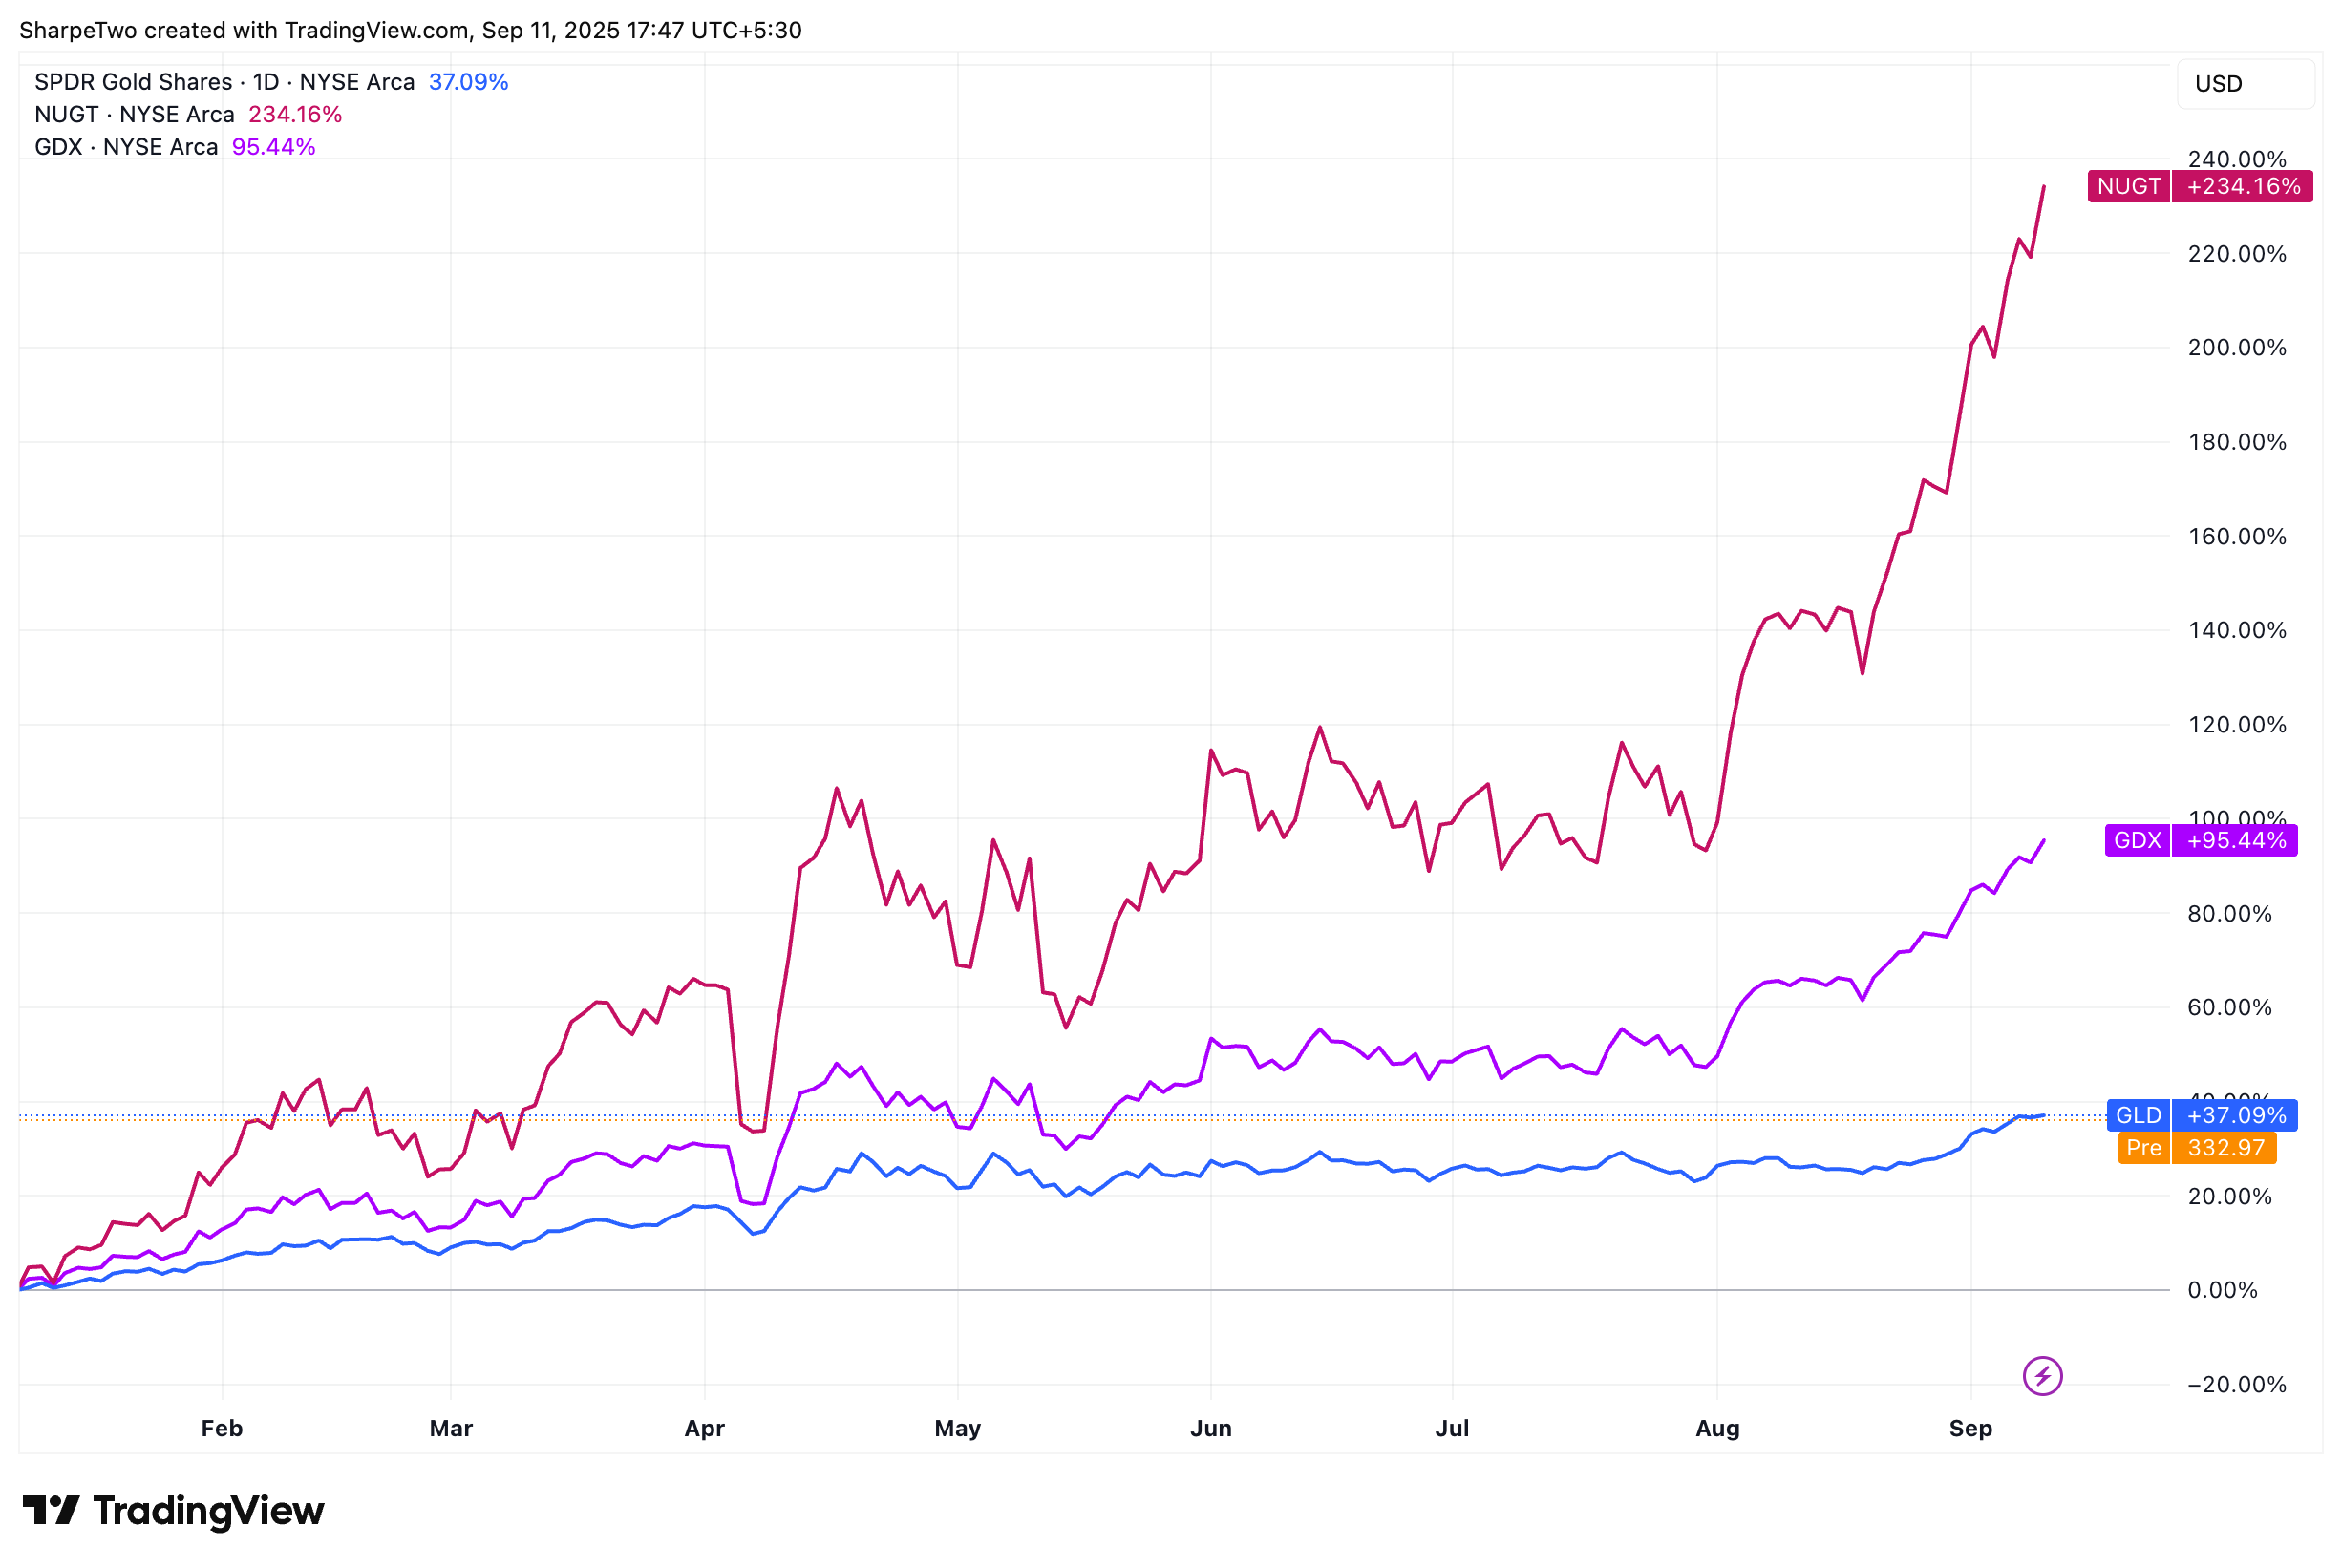
Who would complain about a 37% year-to-date gain? Only those eyeing the +234% they would have pocketed had they bought NUGT on January 1st. The ETF gives you 2x exposure to the gold miner index (GDX). And needless to say, with that kind of rocket fuel, realized volatility has been anything but quiet.
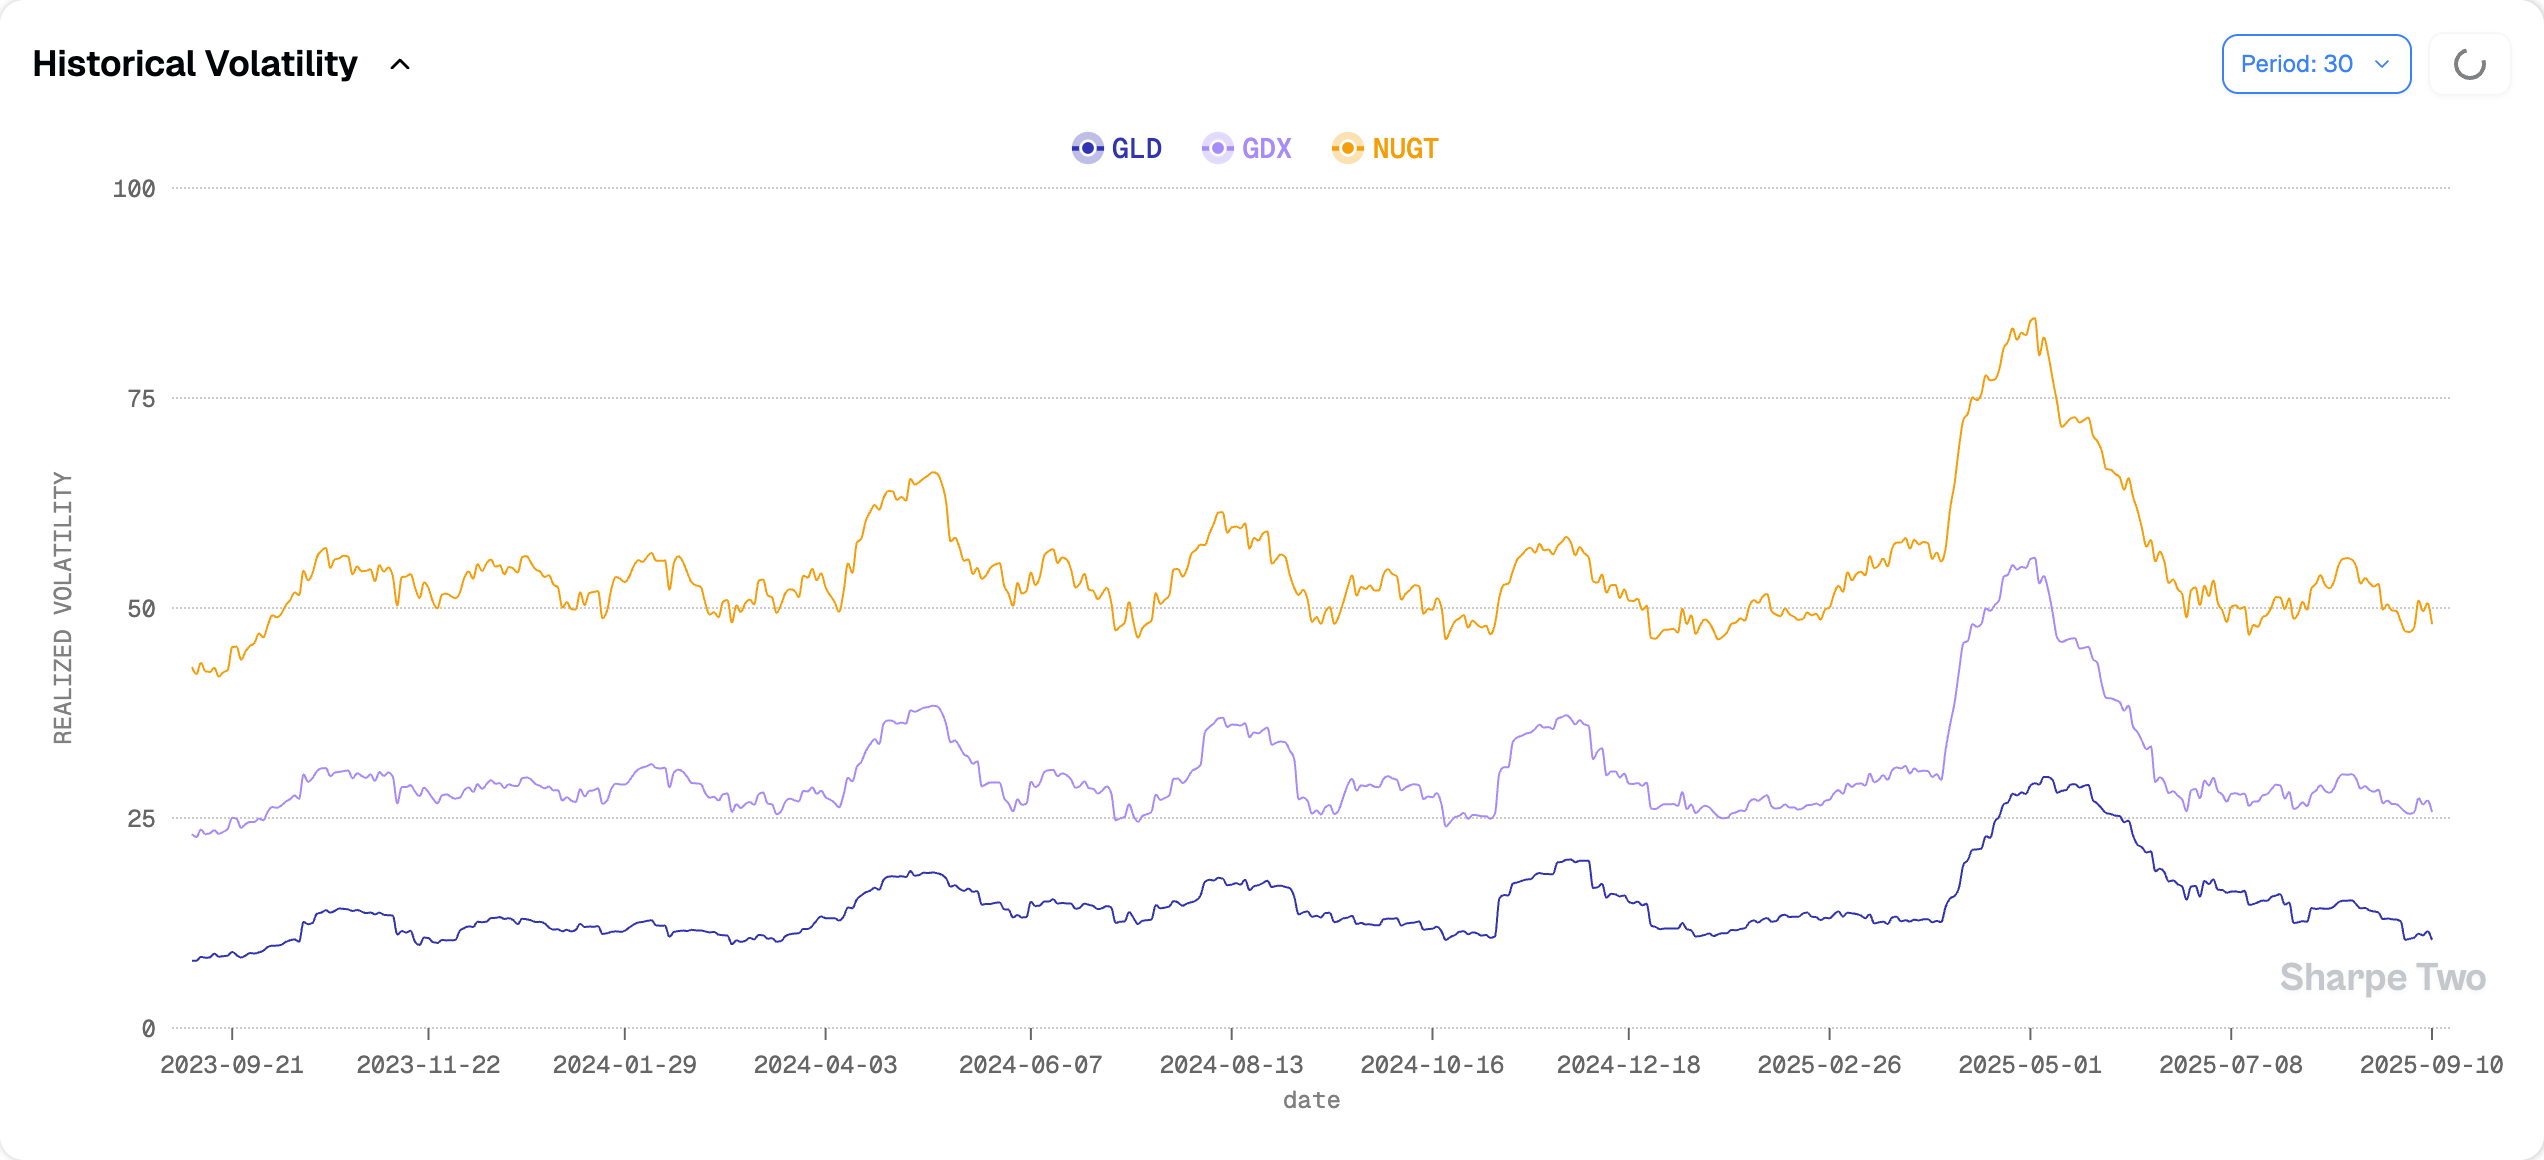
At 48%, NUGT is not for the faint of heart. Still, realized vol now sits at its lowest level in two years—far calmer than during past flare-ups in risk assets, like August 2024 or April 2025.
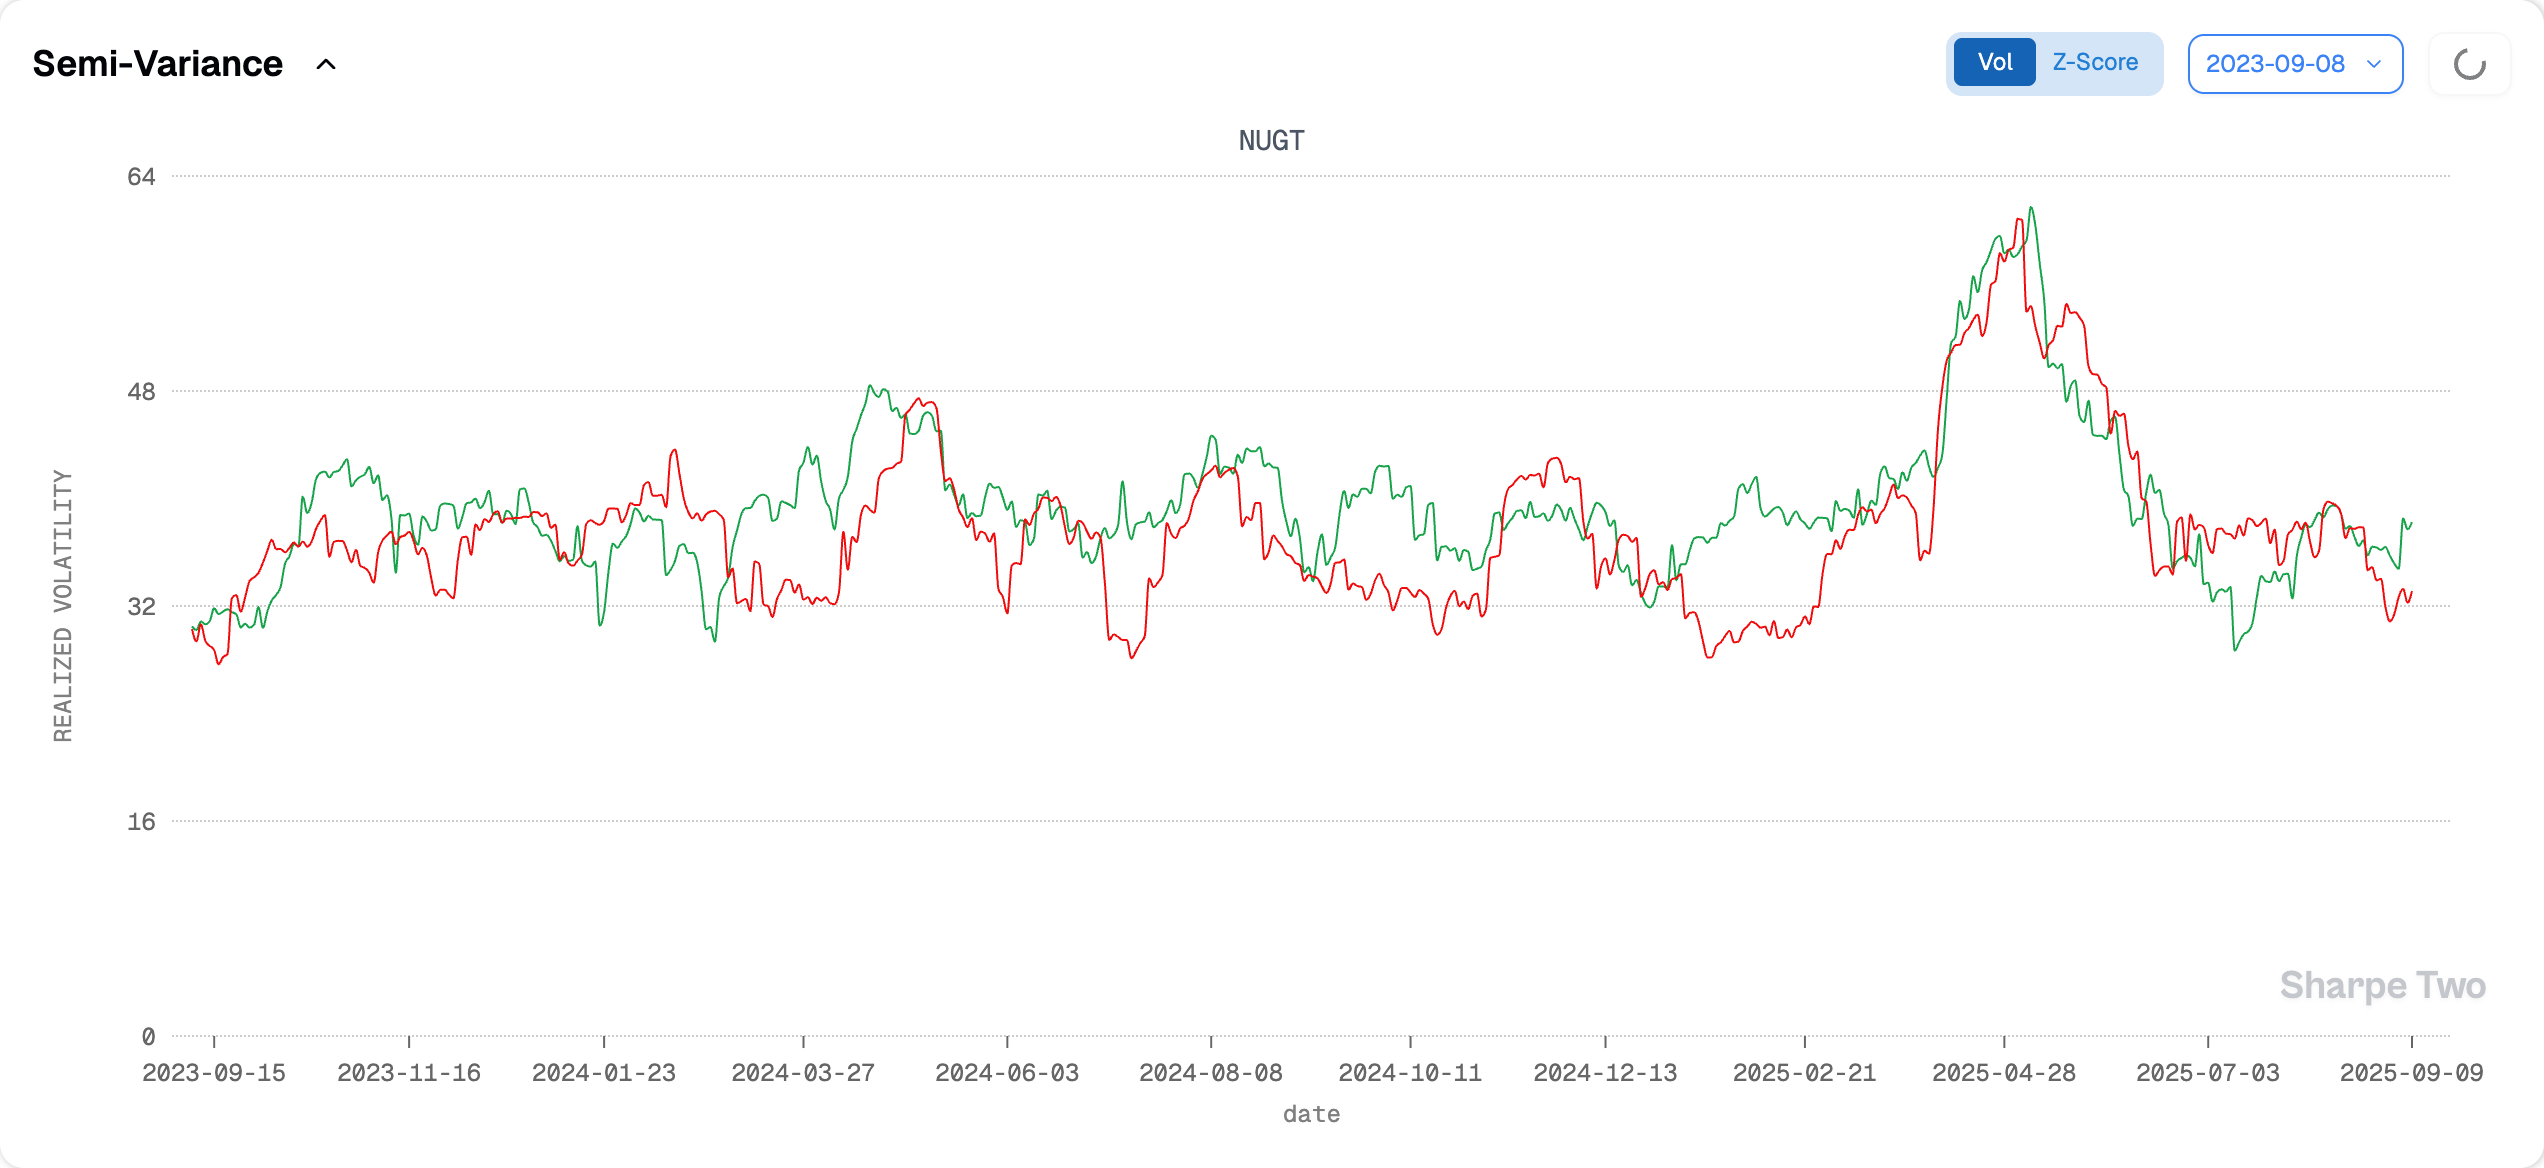
And as you would expect in a super-charged uptrend, most of that volatility has come from the positive side of the tape.
With that backdrop, it is worth watching spot/vol correlation—how option prices react to moves in the underlying.
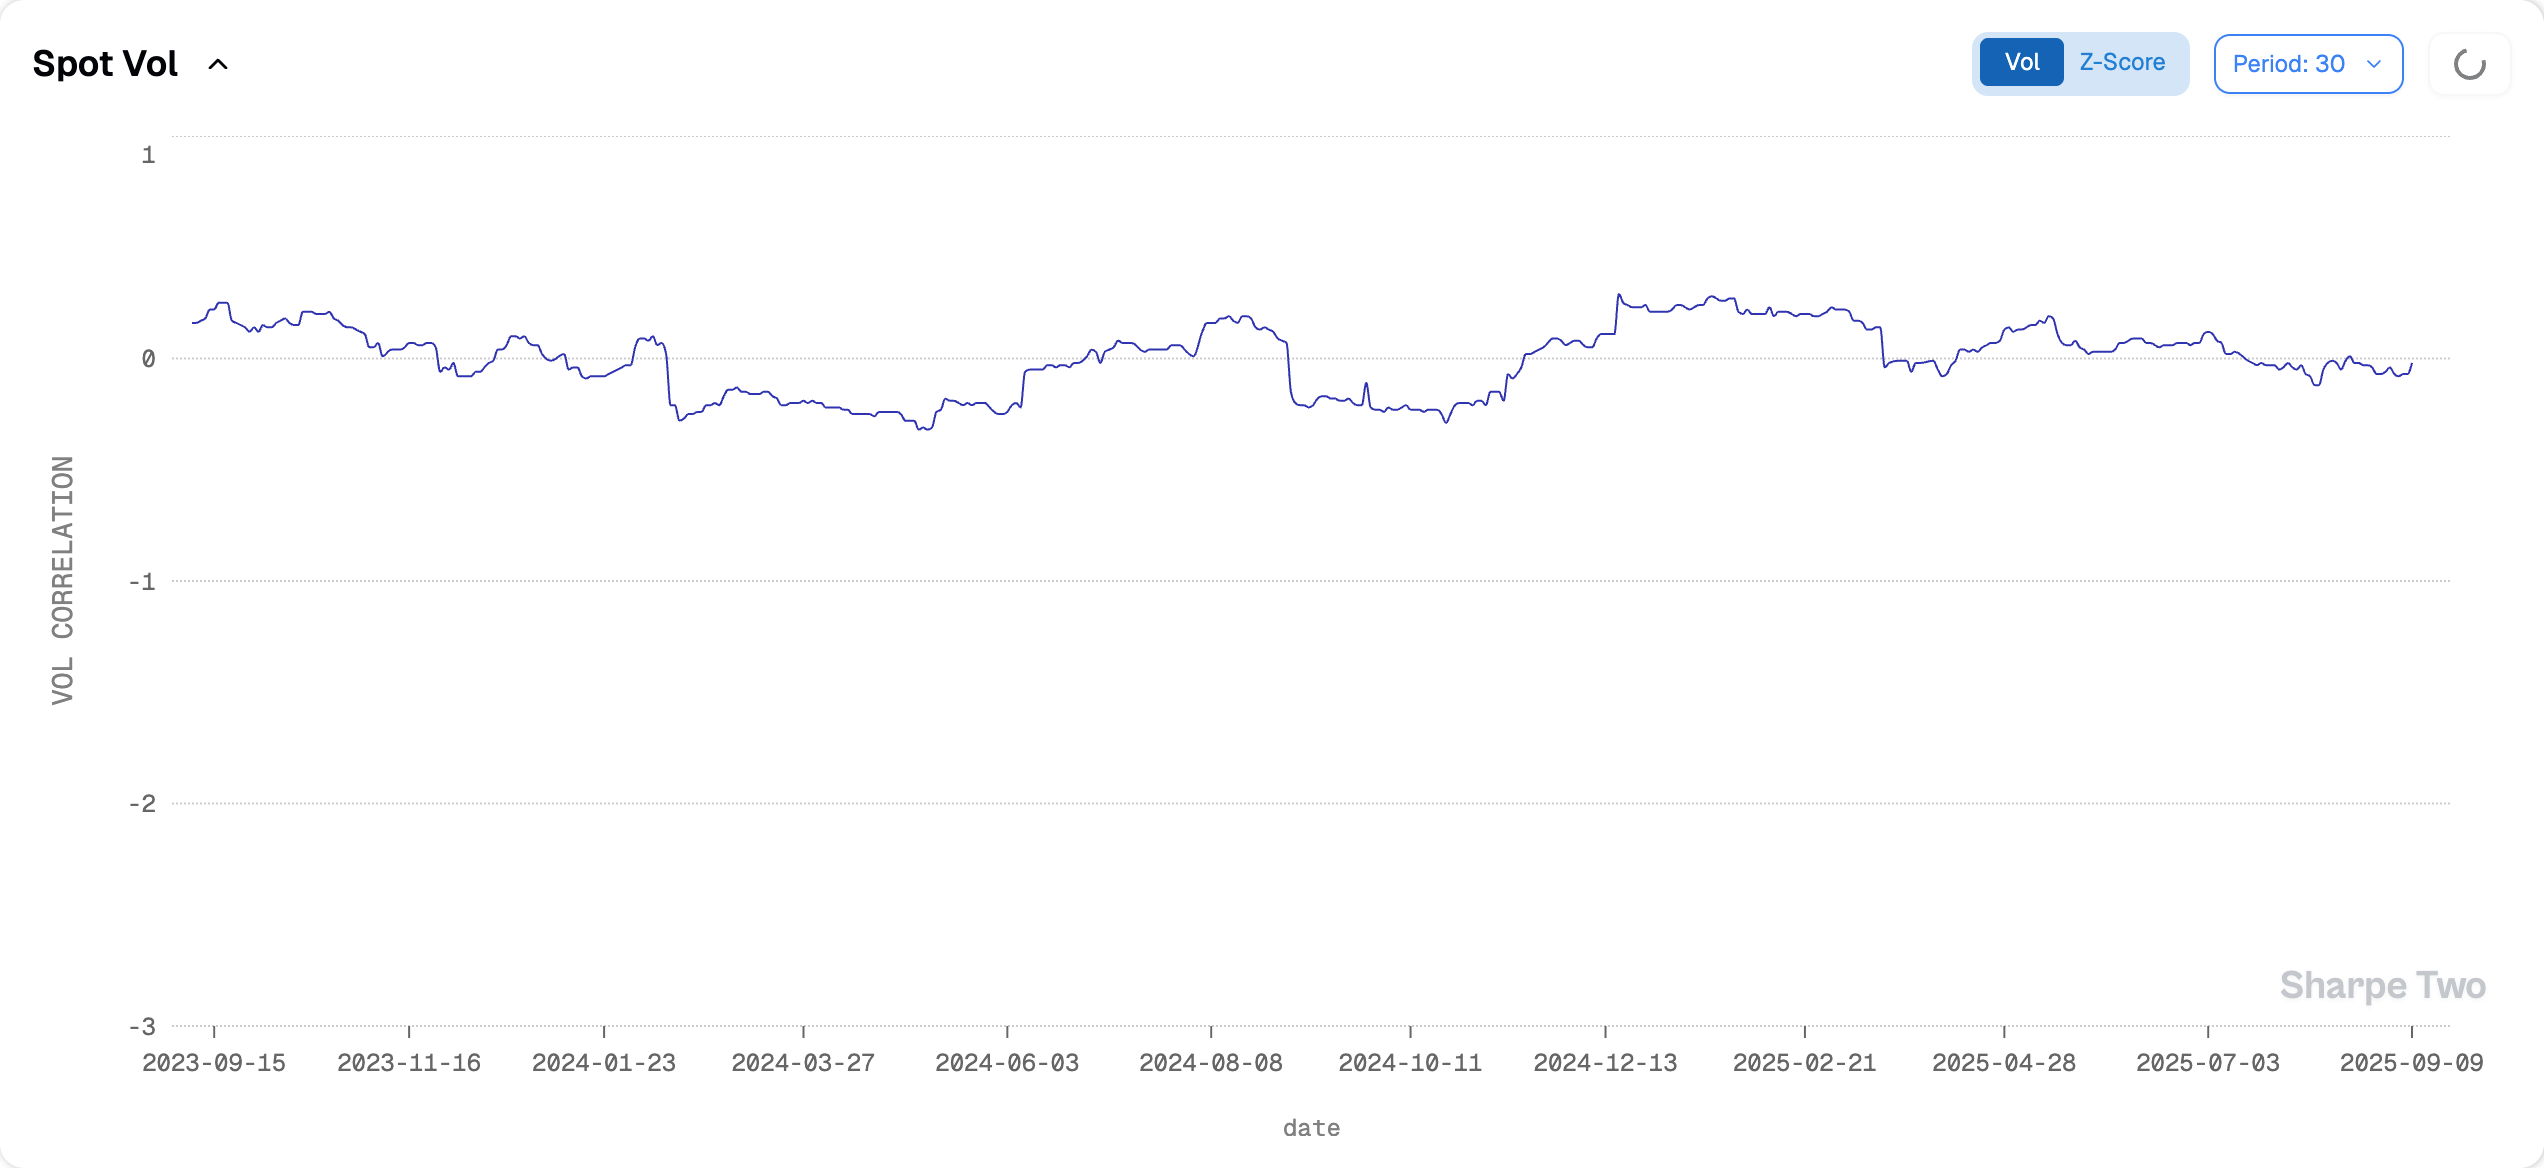
If you are a Sharpe Two reader, you will know this chart did not land here by accident: correlation sits at 0. Meaning? Volatility changes have no relationship with returns. Each does its own thing, which makes options a clean way to hedge against very specific moves in the underlying. For option sellers, though, this is a headache—it likely means they will demand richer premiums to insure that risk.
Before moving on, let us check our forecast for realized volatility over the next month.
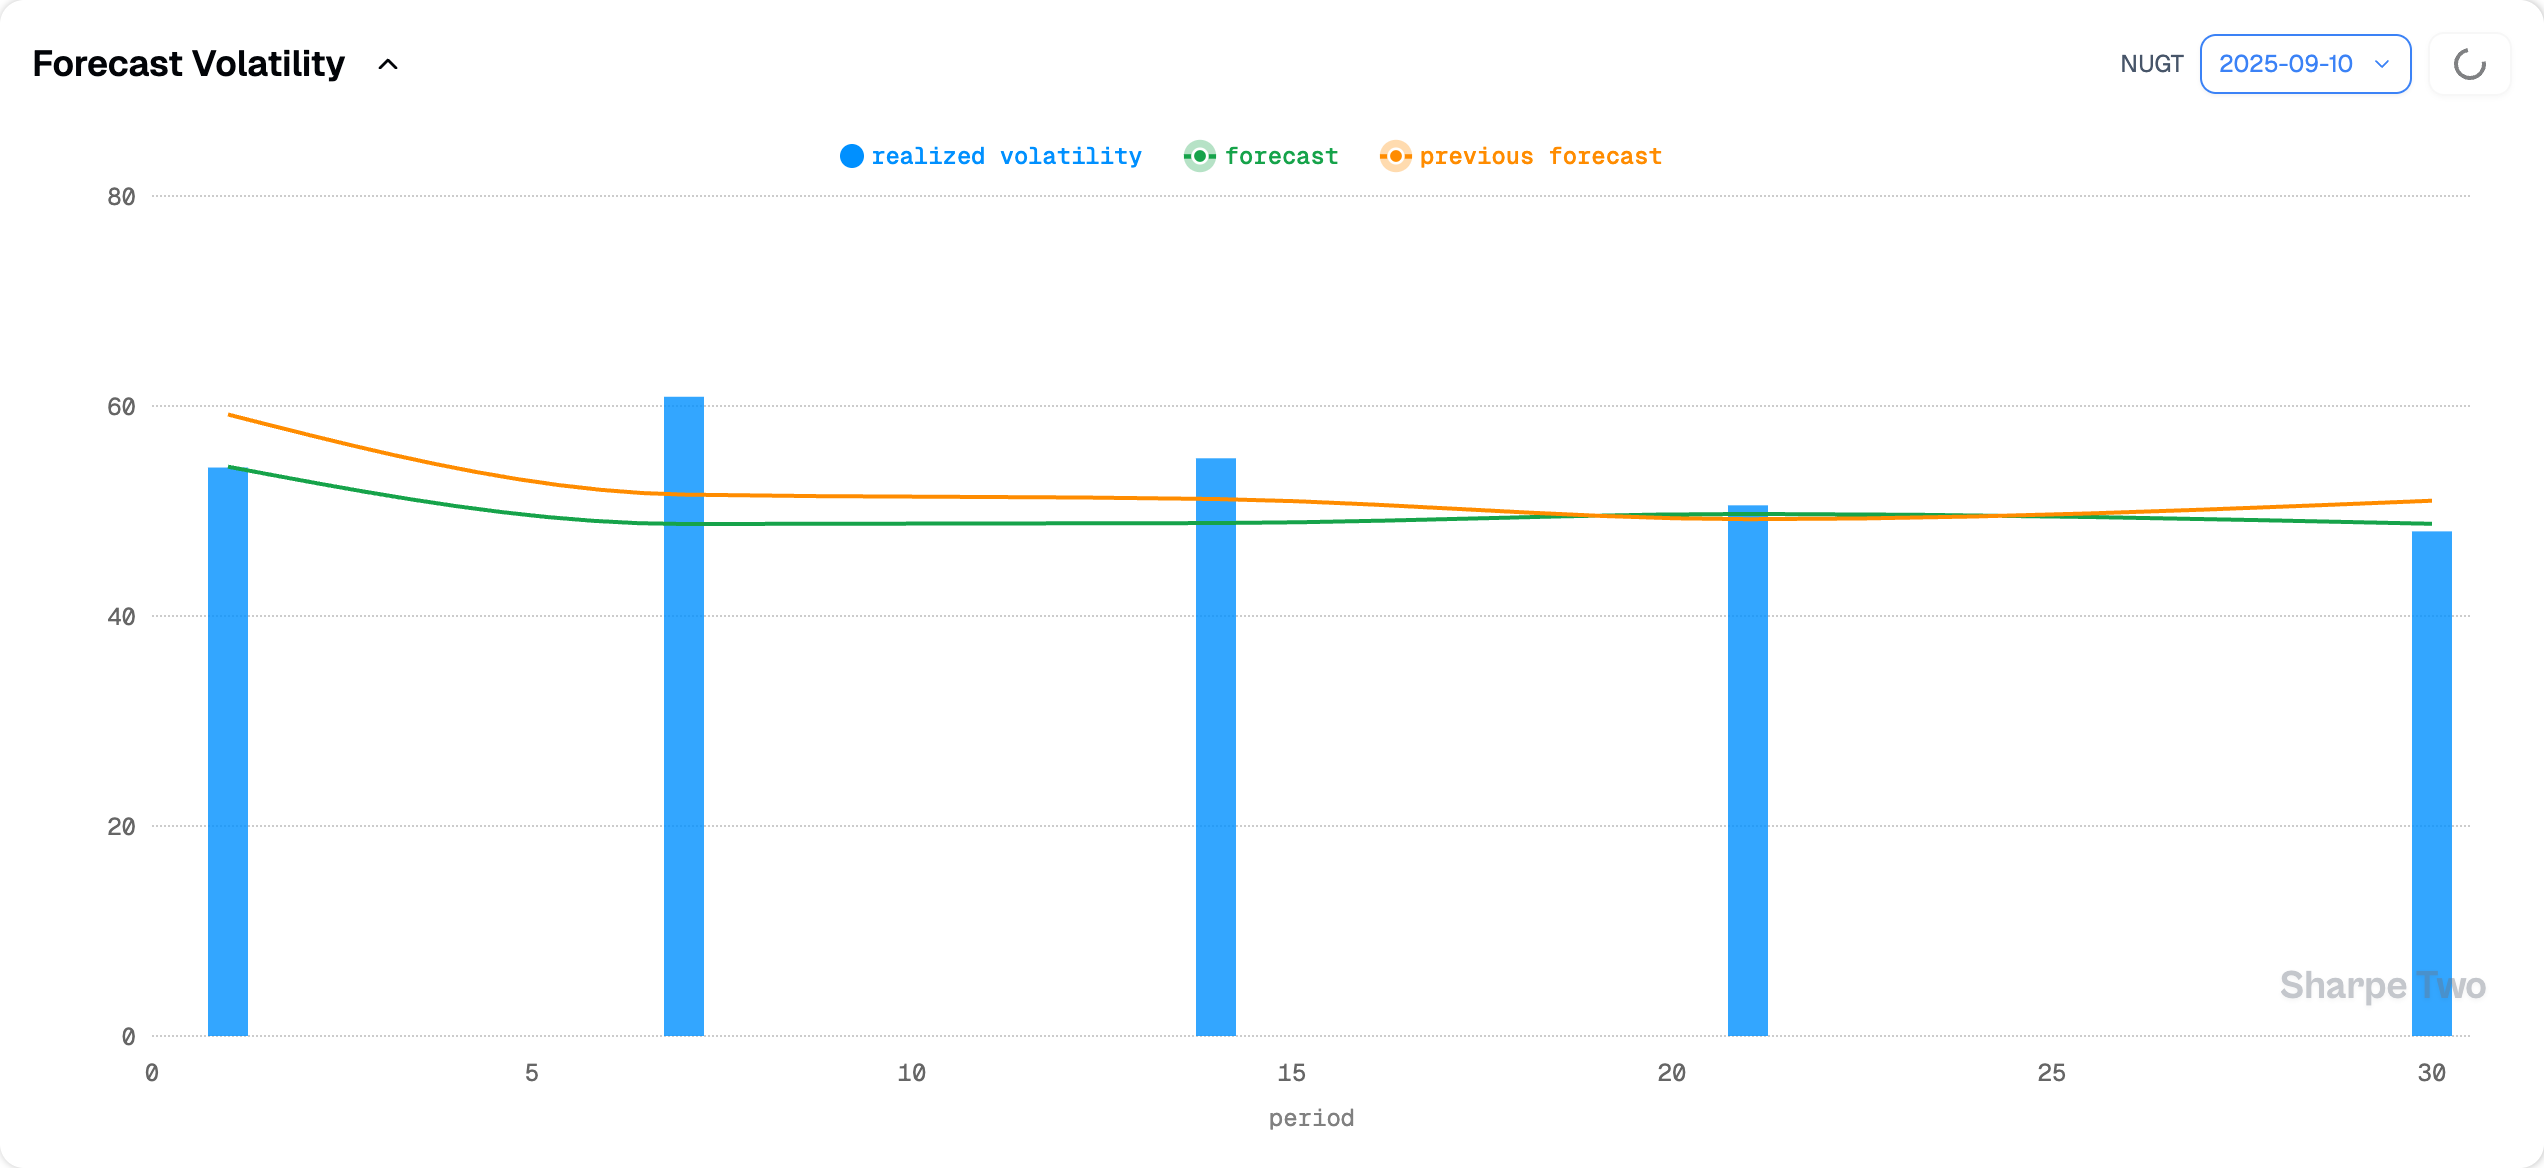
Right now, we do not expect any major regime change. Realized vol should keep hovering in the 50% range. And for day traders: that is a lot of realized volatility. Tread carefully.
With that context in mind, let us see how the options market is pricing the situation.
