Signal du Jour - Long/Short vol ahead of the Fed
A little hedge never hurt anyone.
NVDA's earnings announcement is the talk of the trading floor today. As always, we refrain from speculating on the stock's direction. On the volatility front, straddles look awfully expensive, yet selling them seems premature and potentially risky.
The wisest strategy? Let the market absorb the earnings report. It's perfectly fine to miss the onset of a volatility crush if it allows for a better assessment of expected volatility in the days to follow. Remember, in trading, patience isn't just a virtue—it's an indispensable risk management strategy.
Today, we focus on IWM, the ETF that gives investors a piece of the Russell 2000's action. Unlike its big brothers, the S&P 500 and the Nasdaq, the Russell 2000 is a melting pot of small to mid-sized U.S. companies. This mix makes it particularly responsive to the ebb and flow of macroeconomic data and, of course, FOMC meetings.
Speaking of FOMC meetings, we've got the minutes from the January meeting on the calendar this Wednesday. With the market's reaction to these meetings being somewhat of a wildcard, it only makes sense to weave a hedge into our trade strategy for a bit of extra security: we will look to buy the volatility in IEF.
Let's dive into the specifics.
The context
Amid the roaring rally that kicked off in early November 2023, uplifting U.S. equities across the board, the Russell 2000 has notably trailed behind its peers. While the S&P 500 and the Nasdaq surged ahead with gains of 14% and 19%, respectively, the Russell 2000 managed a modest increase of just 9%.
The reason behind this underperformance?
The Magnificent Seven, or "Mag7." The composition of IWM means it doesn't ride the same tech wave that propels the larger indices. Actually, IWM finds itself at a disadvantage, particularly affected by market expectations surrounding interest rate cuts. Smaller companies, which dominate the Russell 2000, face challenges in a high-rate environment, hindered by limited access to cash and credit compared to their larger counterparts.
Last week, the realized volatility in IWM has notably surged above 27. This brings us close to the peak levels observed last year and not too distant from the volatility experienced when the Federal Reserve commenced its rate-hiking cycle.
Given this heightened state of market nervousness, it's reasonable to assume that the cost of insurance, as reflected in the options market for IWM, would be elevated, especially just a few days before the release of the FOMC minutes. While we refrain from predicting the market's immediate movements, our hypothesis leans towards the likelihood that market participants might be overcompensating for protection in IWM due to the prevailing nervousness. This opens opportunities for traders to lean on the short side.
Let’s dive into the data to confirm our suspicions.
The data and the trade methodology
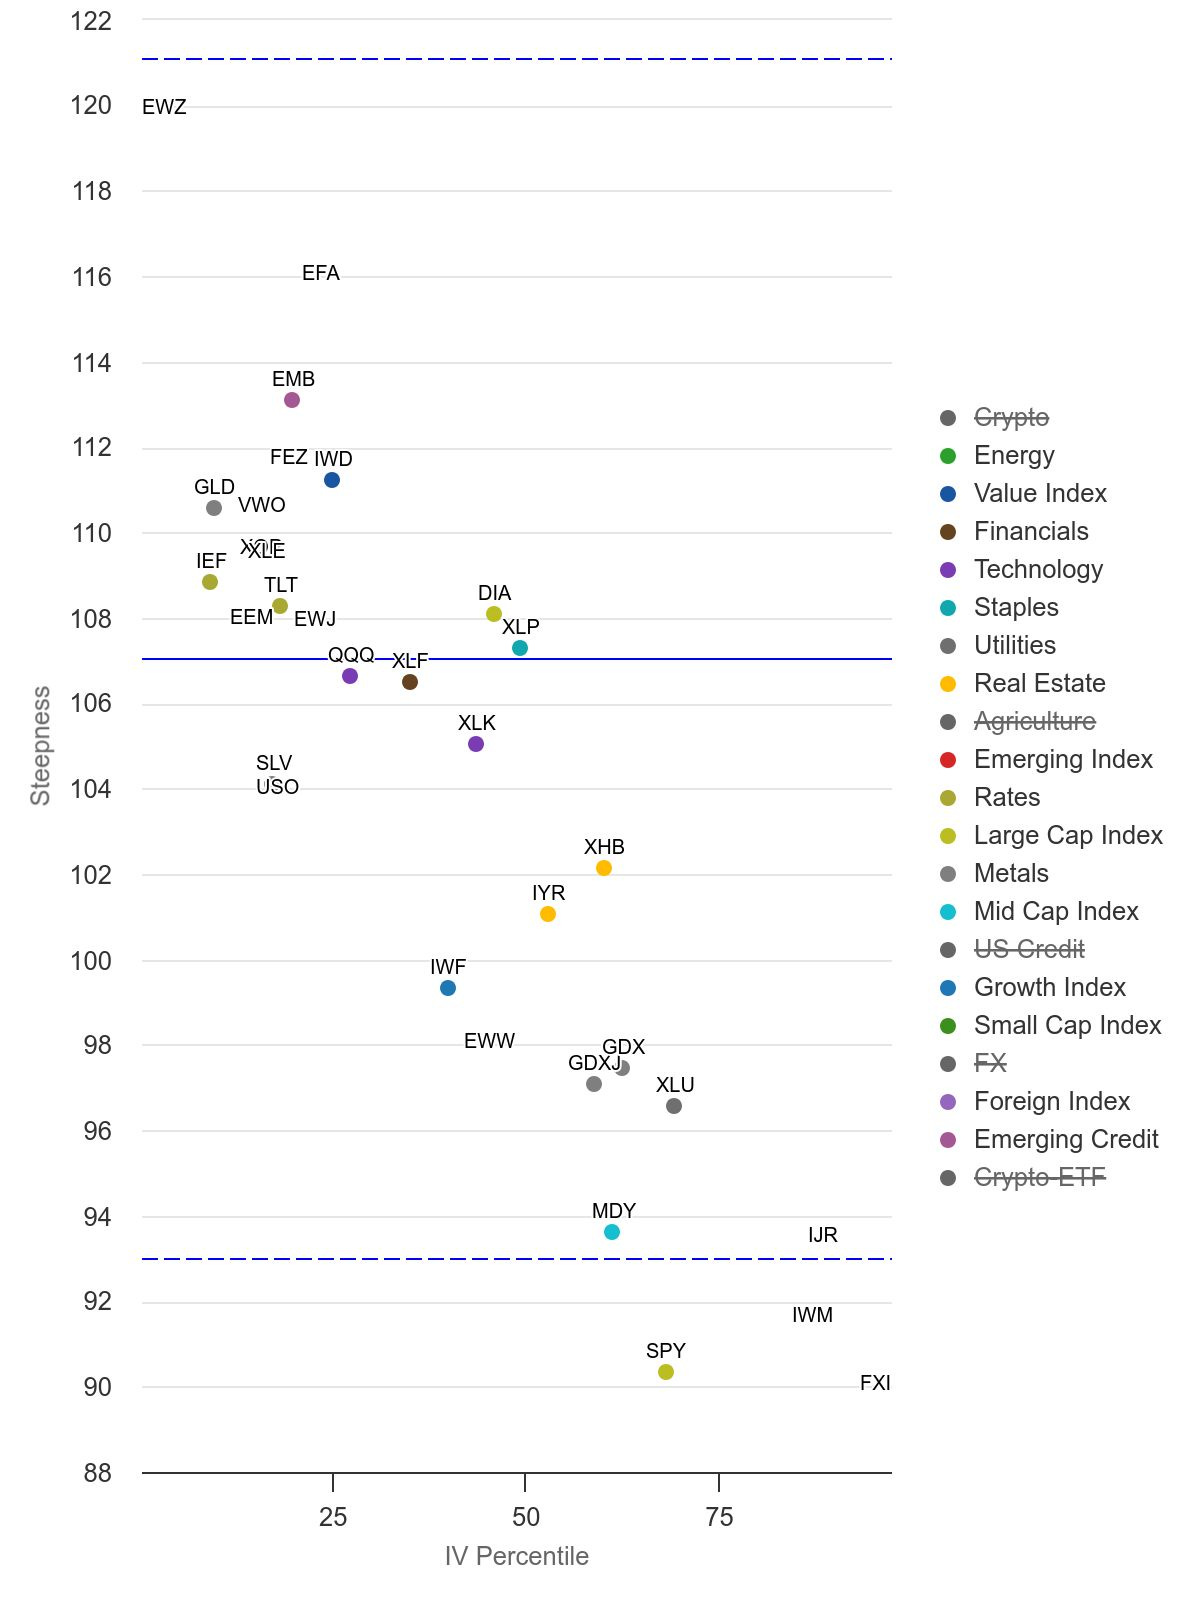
Exploring data from our friends at Moontower.ai, we gain insight into the level of implied volatility versus the steepness of the volatility term structure. This metric is invaluable for quickly identifying potential trading opportunities.
Currently positioned in the bottom right corner, it's clear that implied volatility for IWM is significantly elevated, accompanied by a notable steepness in its volatility term structure (steepness here is quantified as the ratio between 6-month IV and 2-month IV).


