
Signal Du Jour - long vol SMH
A tactical hedge in semiconductors.
After last week's market recalibration, we thought adding some long volatility exposure might be wise, just in case.
Kashkari, the Fed nonvoting member who spooked the market last week, is scheduled to speak this morning. More importantly, we'll receive the latest CPI figures and minutes from the last FOMC meeting on Wednesday. Even if we don't expect groundbreaking results from these events, it's hard to predict how the market will interpret them.
On top of that, when you factor in the current geopolitical risks and the start of the earnings season this week, there's enough justification, in our opinion, to add a tactical hedge.
And what better way to do that than with SMH, the ETF that provides exposure to the semiconductor sector?
Let's take a closer look.
The context
Even if you've been far removed from the markets over the last 18 months, you've likely heard that the semiconductor sector has been on fire. Carried primarily by NVDA, which has seen its value nearly 10x in just under two years, this has been one of the best trades on Wall Street in over a decade. Fueled by the hype surrounding AI, many are screaming "bubble," and a rational mind would be hard-pressed to find any justification proving otherwise—eye-popping multiples reminiscent of the dot-com era's heyday are hard to ignore.
However, do you know one of the key characteristics of bubbles? They tend to keep bursting upward before bursting downward. As a result, realized volatility is often quite high, and SMH is no exception.

Things have settled down from the peak observed after NVDA's latest (stellar) results. Still, in a context where market volatility is slowly increasing again, it's not impossible to see the realized volatility in SMH jumping once more. Will it reach the levels observed in 2022? Who knows? But currently sitting at 29.7%, it's right under the 50th percentile observed over the past four years.
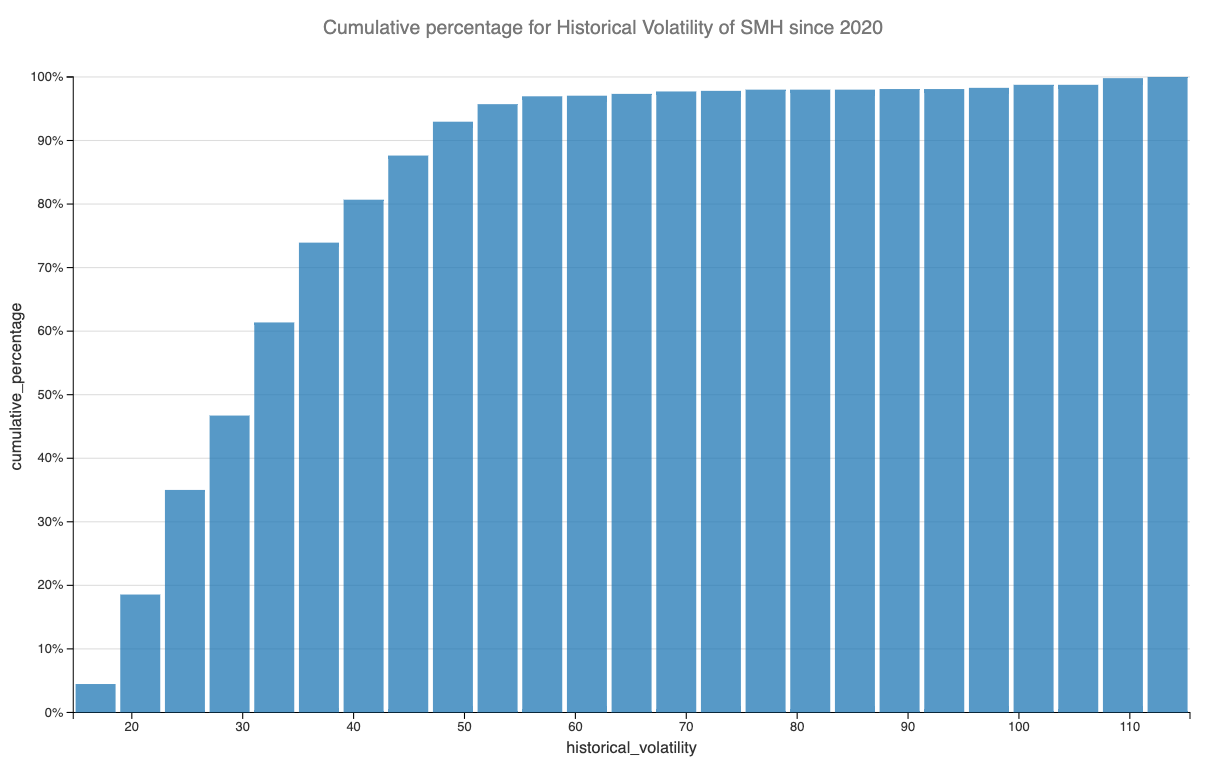
Now, looking at historical volatility to decide on a volatility trade is like driving a car only using the rearview mirror.
Let’s dig deeper into the implied volatility data and the relationship between the two.
The data and the trade methodology
Let's start by examining a reconstruction of the VIX index for SMH over the past two years.

What's striking is the relatively low level of implied volatility compared to the realized volatility. However, it's important to put this into perspective—realized volatility increased as the market exploded. You don't need to buy as many calls when you're already long the stock. Consequently, selling straddles was painful on the upside.
Now, we're not here to try to predict direction, and the fact that implied volatility is relatively inexpensive compared to realized volatility strengthens our idea of placing a tactical hedge on this product.
