
Forward Note - 2025/05/18
Mindset shifts and risk reversals.
A side note - we are releasing something very exciting in a few weeks, and we hope it will transform your trading experience. Get in touch with us if you want to try it.
And here we go, flirting with the 6000 mark again. Another quiet week, another slow grind higher—SPX added 2.6%, putting it firmly back in the green on the year and just 3–4% shy of all-time highs. The Nasdaq did better once again, tacking on 3.5% and reinforcing the sharp shift in investor mindset: risk appetite is back, and tech is leading the charge.
Need more proof? The outlook for the Mag 7 has flipped. NVDA is now down just 2% YTD, and TSLA—up another 8% last week—is “only” down 7% for the year. That’s starting to look like another comeback for the history books.
And if you still need convincing: VIX flirted with the 16 handle (even if we didn’t quite see it trade there), and closed the week at 17.24.
Over the last two weeks, we’ve been questioning whether the regime shift was real. We’re starting to get some solid evidence. Since the peak of trade tensions four weeks ago, realized vol in SPX has clocked in at “only” 22.5%.

It goes to show: the agitation was really confined to a tight window—those two chaotic weeks at the end of March and start of April. Since then, market swings have cooled off materially. Investors have grown numb to the uncertainty, and policymakers have been careful to float hints of resolution before anything spilled over too hard into the real economy.
As always, realized volatility is just a rearview metric—you cannot base serious decisions solely on it. But we also know it clusters. Which raises the obvious question: what would it take to push 30-day realized vol back above 30%? With a truce now announced between the U.S. and China (as of Monday), it’s getting increasingly difficult to pinpoint a credible source of short-term disruption.
And it shows in the curve. SPY’s current term structure is the cleanest contango we’ve seen in months—eerily reminiscent of November 2022 and 2023. Those setups were followed by monster rallies… and months of volatility collapse. Until the next catalyst, of course—be it the regional banking blow-up in March 2023 or the brief flare-up in April 2024.

Over the weekend, we learned that Moody’s downgraded the U.S.—and for the first time ever, the country no longer holds a triple-A rating from any major agency. Will it matter? We doubt it. But could it slowly shift the tone in Washington and reignite the eternal debt ceiling drama? Almost certainly.
Still, even that feels like a stretch if you are searching for a deep, lasting catalyst that could materially alter the trajectory of U.S. equities.
So what does a vol trader do in this environment?
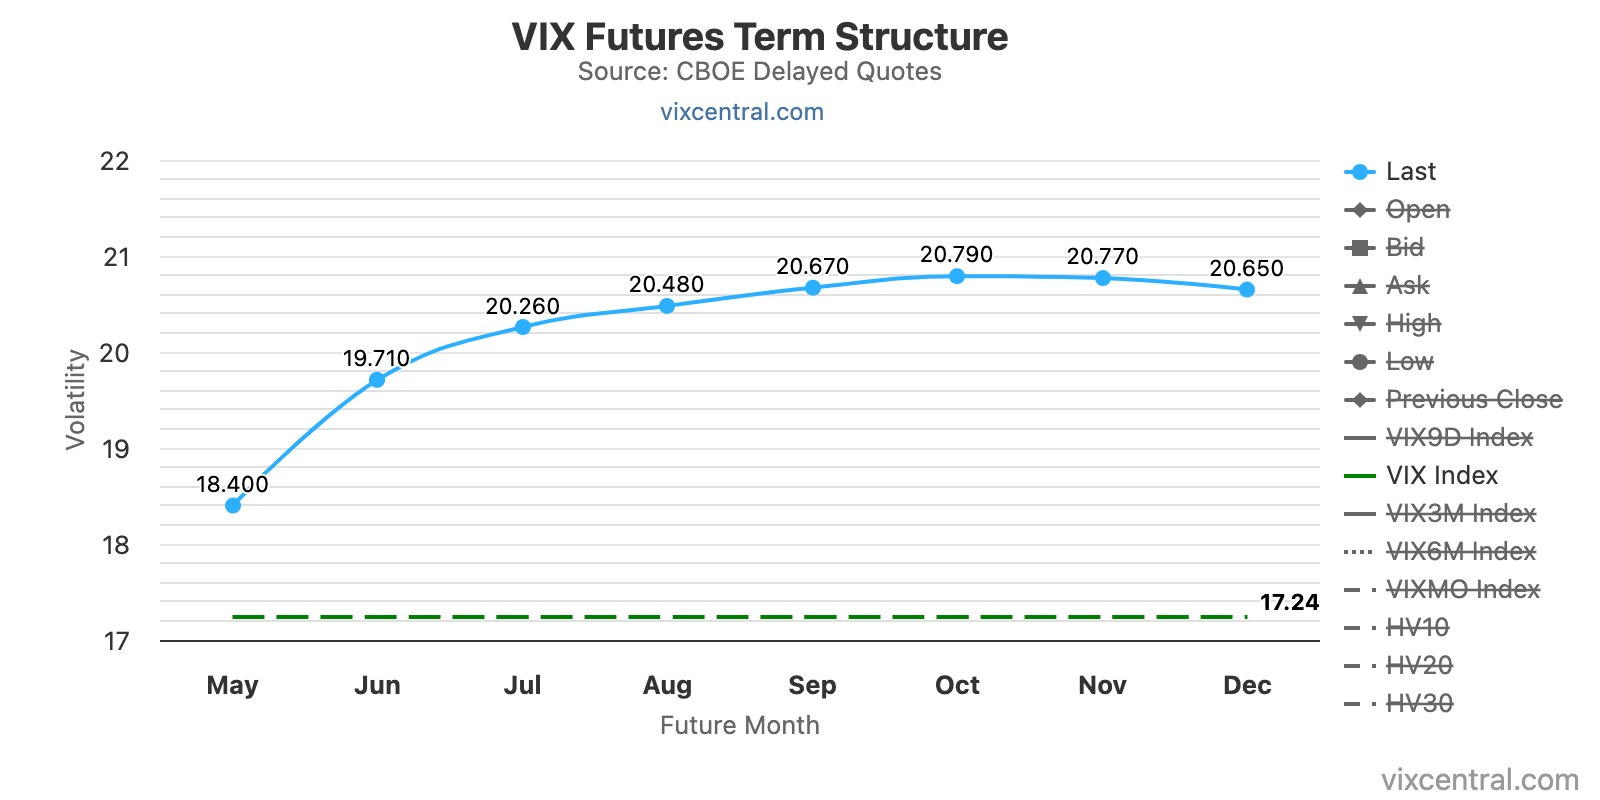
You start by paying attention to the small tells. At Friday’s close, there was a 4-point contango in the VIX term structure when measured via options. But only 1 point when measured with futures. That divergence does not mean a crash is coming—but it does mean you can pick up relatively “cheap” options and potentially sell futures against them.
One thing we would not do? The reverse. As last month reminded us, VIX futures almost never trade at a premium to spot during a panic. So selling the option and buying the future is a recipe for pain if anything does go wrong.

If you're looking for simpler plays, the context is a bit tricky. The variance risk premium is still broadly negative—which usually means better odds for long option positions.
That’s been one of the key lessons of 2025: everyone knows the short side of the options market is well-worn. Sell premium, manage risk, repeat—it’s a strategy with a long, profitable track record. What’s less understood—and still somewhat frowned upon—is loading up on the long side.
We were actually counting but we have already presented more long volatility signals this year than in all of 2024 with our latest article on XLK.
But trading is not about loyalty to frameworks. If the odds shift, we shift with them. Carefully, but confidently.
And considering how calm things have been over the past two weeks, we start to see solid arguments to be long the front few weeks, just in case: things go go down a few percentages from there and most likely a VIX 17 would become a VIX 20 real fast as the market place wonder if we are back to full blown panic mode, leaving some nice profit on the put side.
Or—nothing happens. The slow grind from last week continues, and realized vol once again outpaces implied, especially on the call side. Wait a second… isn't that the textbook setup for a risk reversal?
There’s some truth to that. Funny enough, we were chatting with a reader on Friday, voicing our hesitation to wade back into those waters. But when the term structure starts to look eerily similar to past periods where risk reversals printed hard—and puts are not exactly cheap relative to calls—it starts to get interesting.

As you can see from the VIX/skew matrix, put pricing normalized relative to calls for most of last week. They are not screaming “overpriced” yet, but the next downside scare could easily flip the narrative.
So—not quite there yet. But definitely something we’ll be watching closely in the weeks ahead.

In other news
Moody’s downgraded the U.S. late Friday, cutting its rating from AAA to Aa1 with a negative outlook—citing the administration’s increasingly dangerous deficit spiral.
One could fairly ask why this didn’t happen back in 2015. But like realized volatility, rating agencies have a well-earned reputation for being… lagging indicators. Still, they’re not to be ignored either.
We do not expect this to have an immediate impact, but it will matter for rates eventually. If the administration hoped to push yields lower (perhaps via an "artificially intelligent" market intervention?) to avoid expensive refinancing later this year, another downgrade does not exactly help.
Full-blown panic in October? Hard to picture. Uncle Sam may have a distant Lannister cousin—he always pays his debts. What the rating agencies are flagging is that doing so will only get harder. But a true default? If we ever get there, VIX at 60 would be the least of our problems.
As usual, thank you for staying with us until the end, and as usual, a couple of interesting read from last week
We will start with a paper that came across our desk this week (thank you Si) and talk about using (not so) alternative (but a pricey) data to infer the direction of an option trade.
A sharp dive into the mechanics behind the YieldMax covered-call ETFs and how they stack up against running the same strategies yourself by Mark Phillips . He shows that even with smaller size, DIY overlays can outperform in net yield and capital retention—if you manage sizing, strikes, and taxes well. It’s a strong case for staying active rather than outsourcing to grocery-store-sushi ETFs. Worth a look if you’re considering income overlays in today’s low-vol regime.
That is it for us, we wish you a wonderful week ahead, and as usual, happy trading.
Ksander
Contact at info@sharpetwo.com.
Disclaimer: The information provided is solely informational and should not be considered financial advice. Before selling straddles, be aware that you risk the total loss of your investment. Our services might not be appropriate for every investor. We strongly recommend consulting with an independent financial advisor if you're uncertain about an investment's suitability.