
Trade Anatomy - Short Vol in TLT
40% off our yearly plan for the last post mortem of 2025.
Second Trade Anatomy of the week as we are wrapping up 2025. We will have more to say tomorrow and Sunday, but it is the beginning of our end of year sales: enjoy 40% reduction on our yearly plan starting today until 2026.
Last week, we published our latest Signal Du Jour for 2025 and presented a short volatility trade in TLT. The Fed had cut interest rates by 25bps and announced an expansion of its balance sheet, a more dovish stance than most had anticipated. And while implied volatility in TLT was elevated early in the week, there were still signals suggesting that the market may have been a little too angsty for what was likely to unfold.
As we moved into the second part of the month, bonds did what they have done for most of the second semester: wander around with no clear direction, leaving more variance risk premium on the table for anyone willing to sell options to investors fearful that something might happen in the final hours of the year.
While we wrote about that trade on Friday, we had actually put the position on Tuesday with our Discord group (you can join it by subscribing to our platform), as the odds were strongly in our favor. This analysis will focus on that position and, no suspense there, it was once again a successful trade.
Which means that all our Signal du Jour since the end of August were correct. Let us be clear: last year, we did not have such success. Back then, we were saying that the variance risk premium was far more competitive than when we used to trade it a decade ago. We needed to adapt as our trading was dependent on it. What changed then?
As you know, we switched from descriptive analytics to predictive analytics, trying to estimate whether the implied volatility we sell today is likely to exceed the subsequent realized volatility. Not the level of implied, not the level of realized, but literally whether we will observe the presence or absence of VRP when the options expire. This shift makes all the difference.
Let us dig in, for the last time of 2025.
The Trade
Last Friday, we highlighted a short volatility opportunity in TLT, pointing to the 86.5/89.5 strangle expiring on Dec 22. Despite the FOMC being behind us, implied volatility in TLT had ticked back up into the end of the week and triggered our short term signals with a high probability of success.
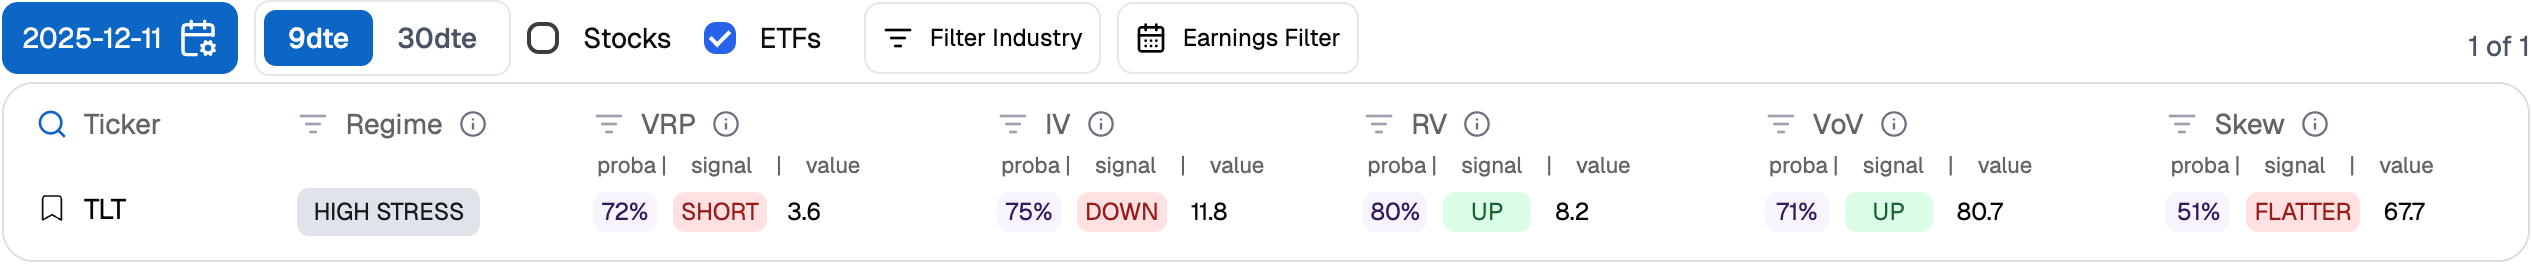
We pointed out that the implied volatility sold had a 72% chance of exceeding the subsequent realized volatility. That trade is, technically speaking, still in play and, barring a major surprise, should be removable by the end of the week at a 25% profit. Instead, we will review the trade we put on with our group on Monday, a few days before publishing that Signal Du Jour and ahead of the FOMC. The mechanics and PnL drivers are ultimately very similar.
We took the 86/91 strangle expiring on Jan 16, 2026, as the odds were high pre FOMC.
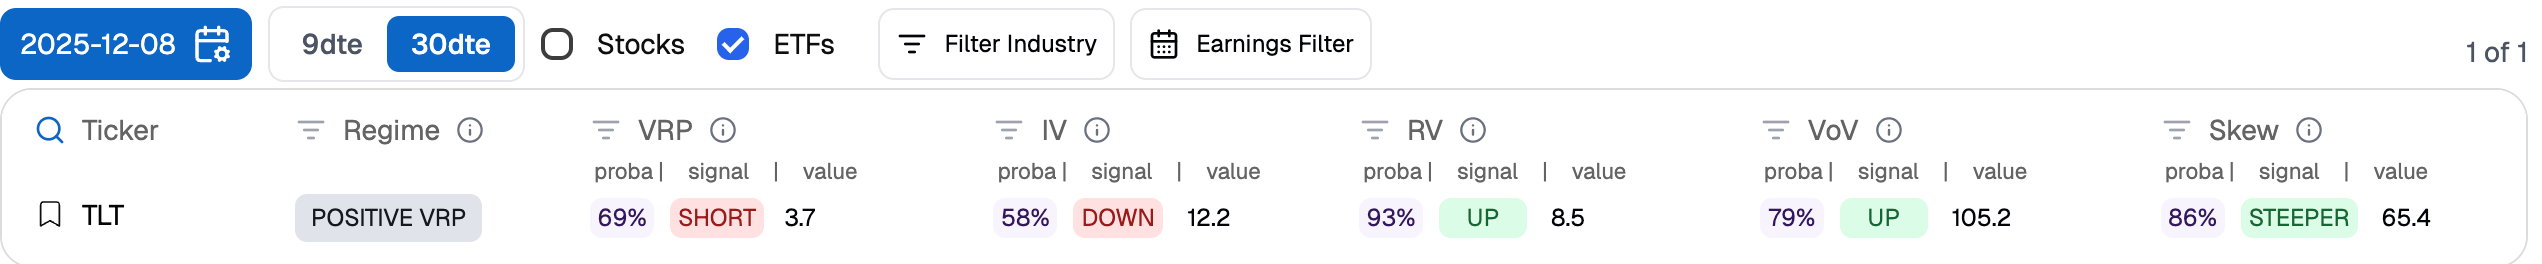
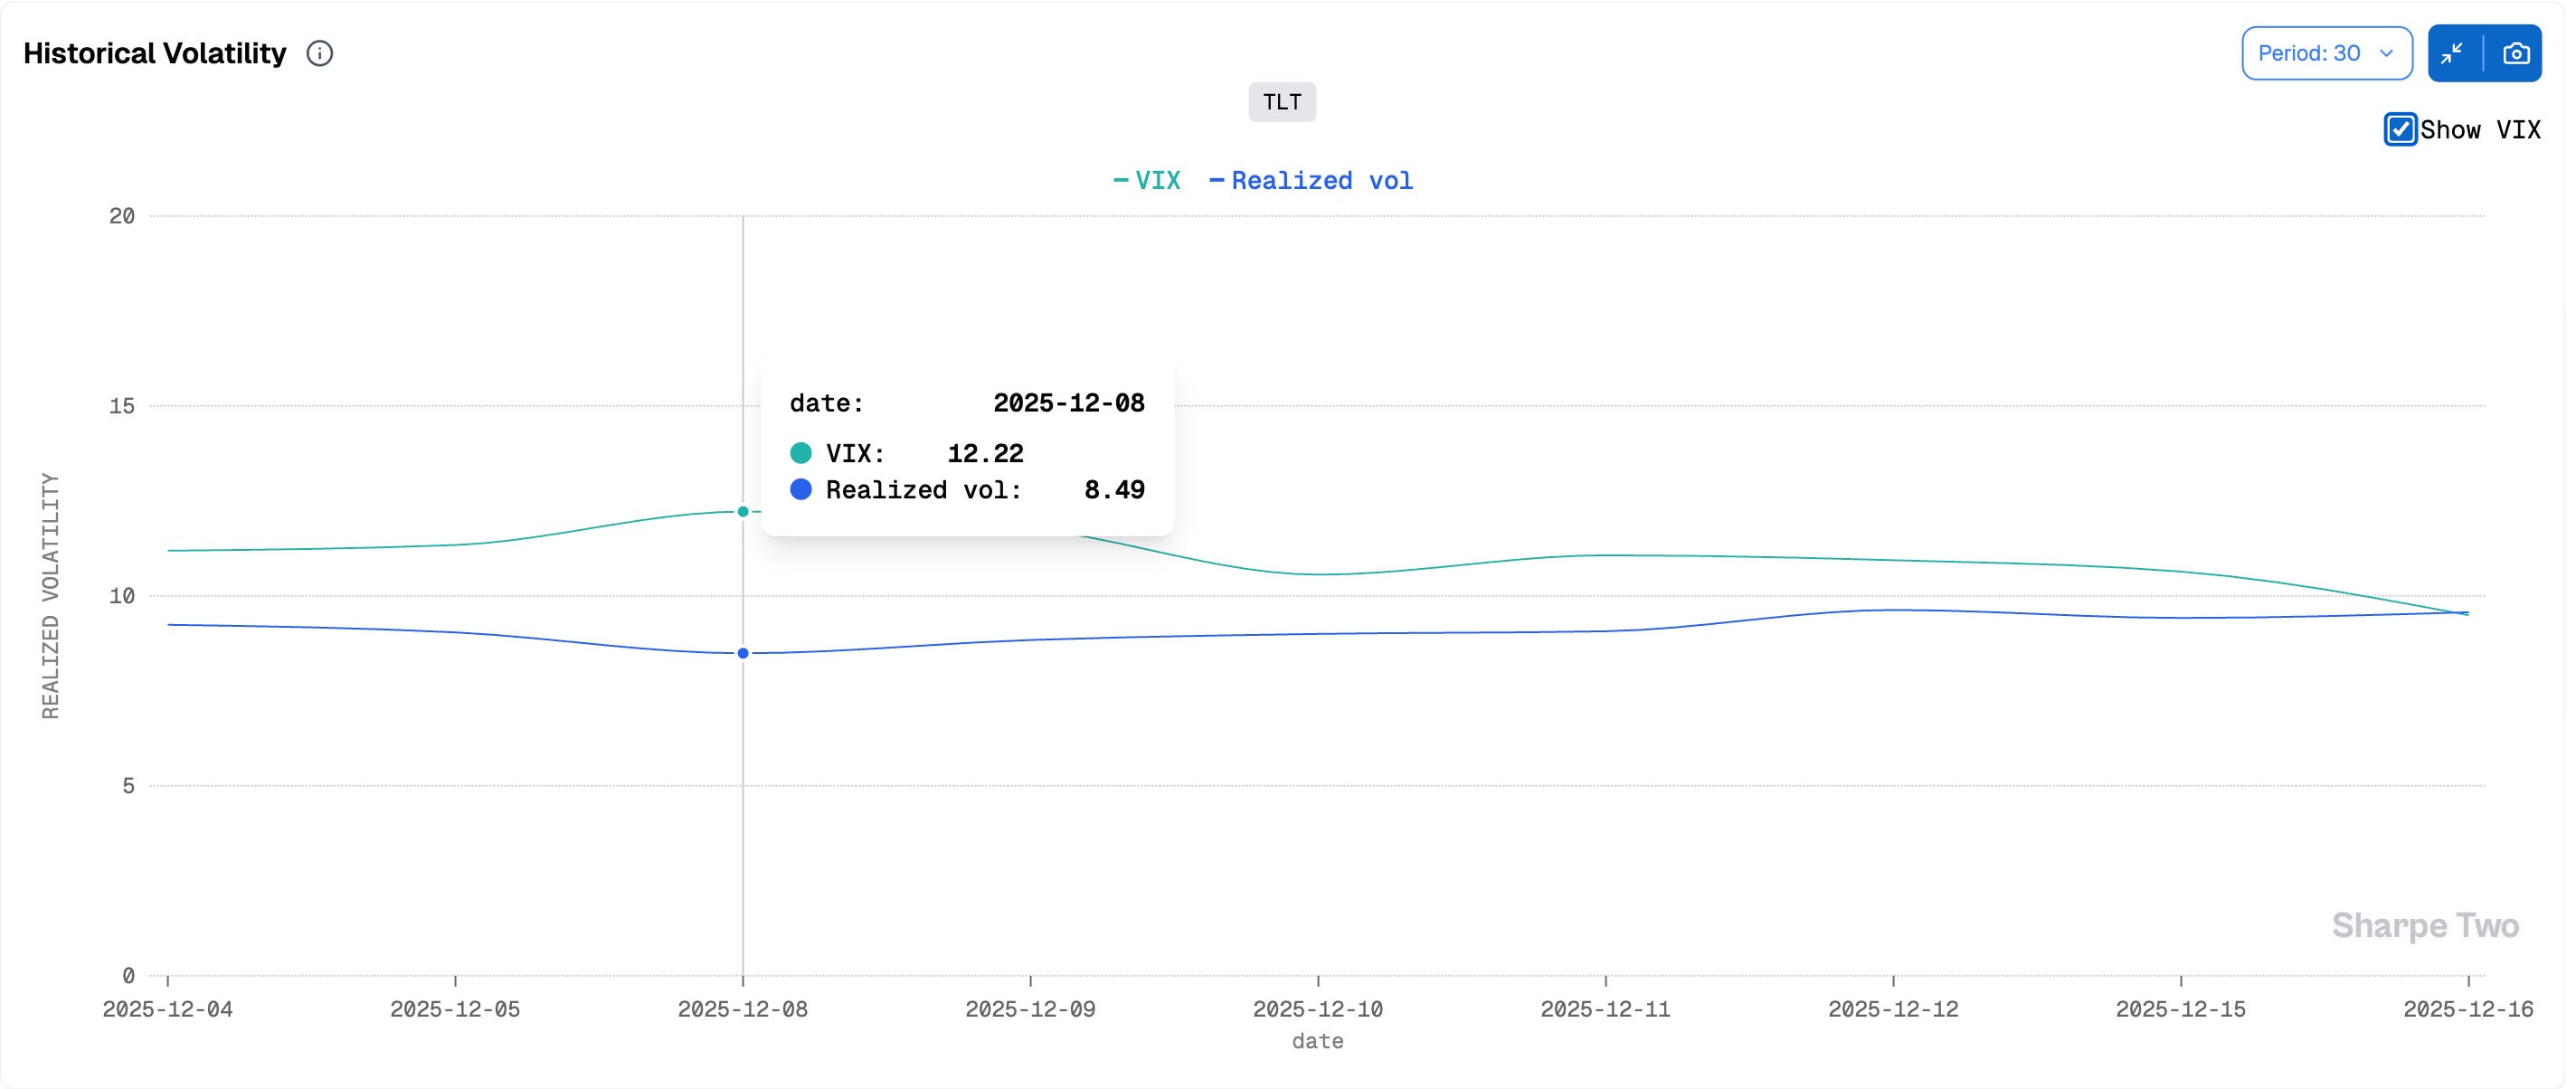
As we can see, implied volatility was a tad higher at 12.2, and the probability of seeing it exceed subsequent realized volatility over the next 30 days stood at 69%. The VRP, at 3.7, left plenty of room for error, even if the Fed had deviated slightly from the expected course of action. In the end, while realized volatility did tick up a bit, from 8.5 to 9.5, implied volatility came down meaningfully, and the position was never challenged, even through the event.
We should therefore expect a fair share of the PnL to be driven by vega, especially early in the trade. From a pure trading perspective, this was the interesting part. An astute observer could have guessed that the FOMC was going to be fairly uneventful simply by watching implied volatility drift lower ahead of the event. While 12.2 was available on Monday and Tuesday, you were looking at closer to 11 right before the announcement. Not exactly a sign of deep concern from the market, or from those who may be in the know.
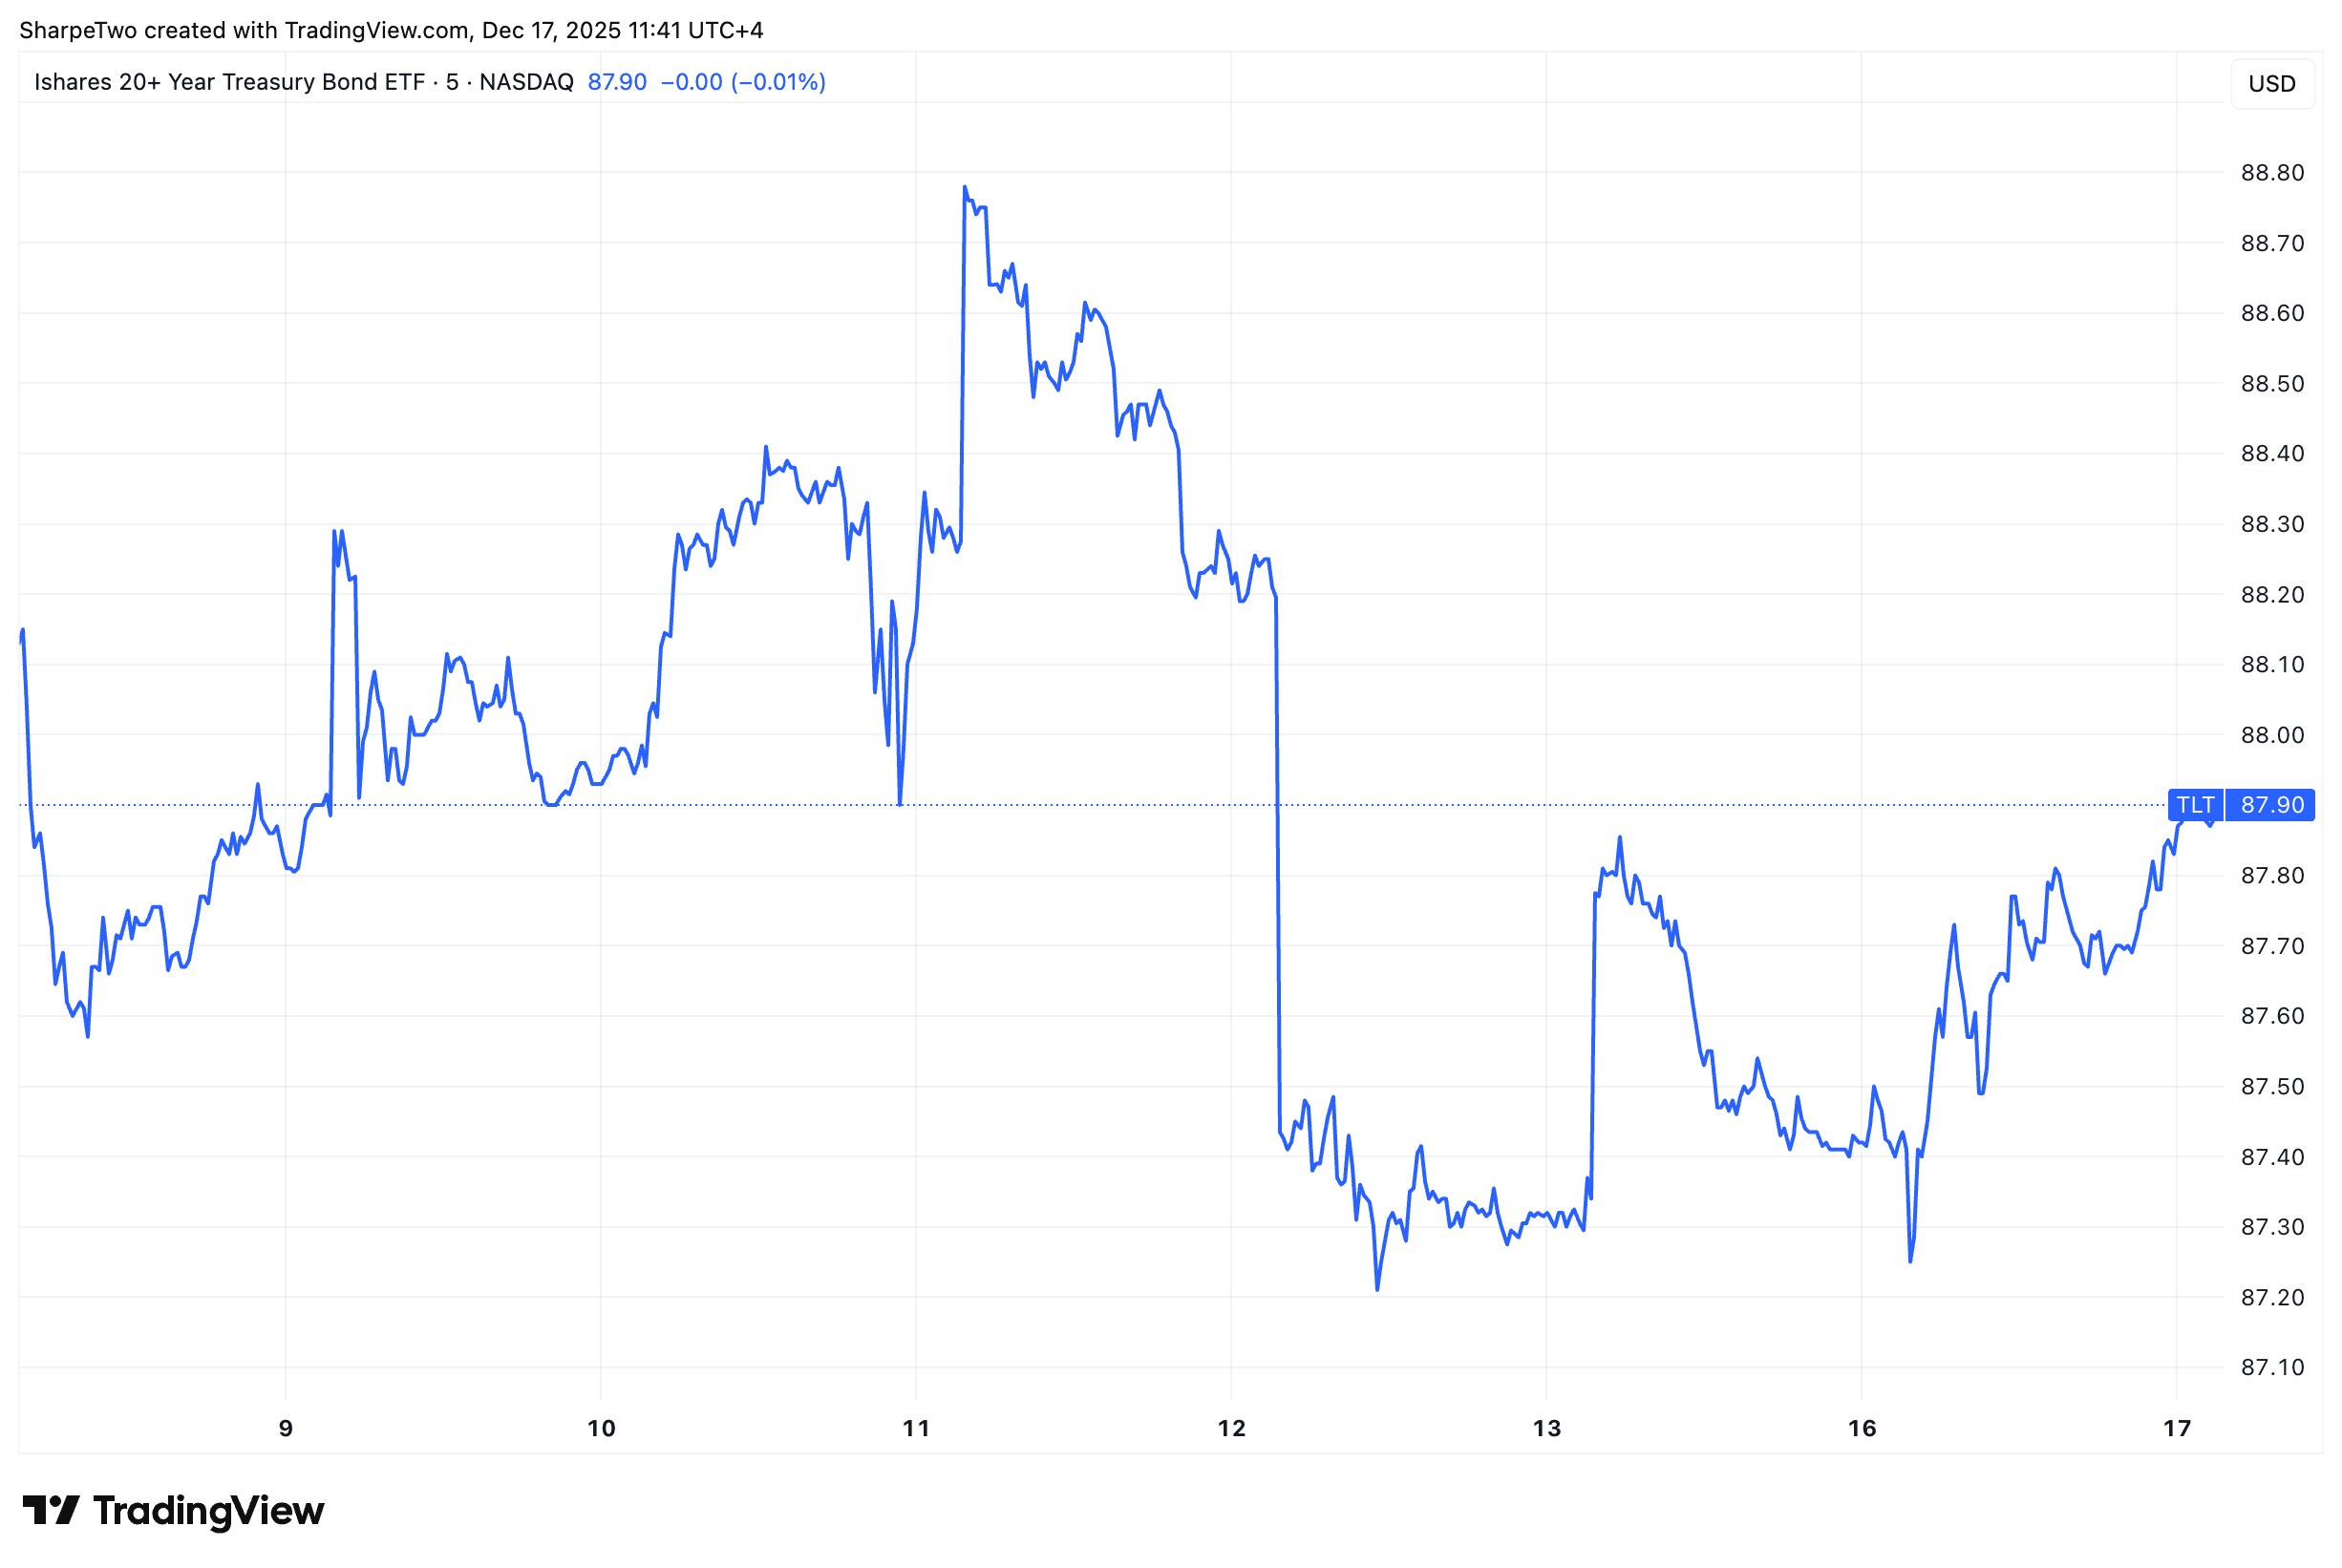
As usual, we did not delta hedge, which exposed us to path dependency. Still, no real surprise here. Rates wiggled around, down during Powell’s press conference and back up the following day, but TLT itself stayed anchored around the 88 strike. As a consequence, delta never really became an issue for the position.
While we insist that switching from descriptive to predictive analytics has materially improved the quality of our signals, it is worth taking a moment to stress the importance of path dependency. We were fortunate here that bonds did not decide to trend aggressively in either direction as the market positioned for next year and, perhaps, started winding down 2025. Yes, there was VRP and enough premium to make us more comfortable around the event, but this was closer to a bet on the expected price distribution of TLT than a pure variance harvesting trade. That nuance matters. The returns can be very attractive, but one has to remain fully aware of where the risks actually lie.
In the end, we stayed in the position for a little under a week.
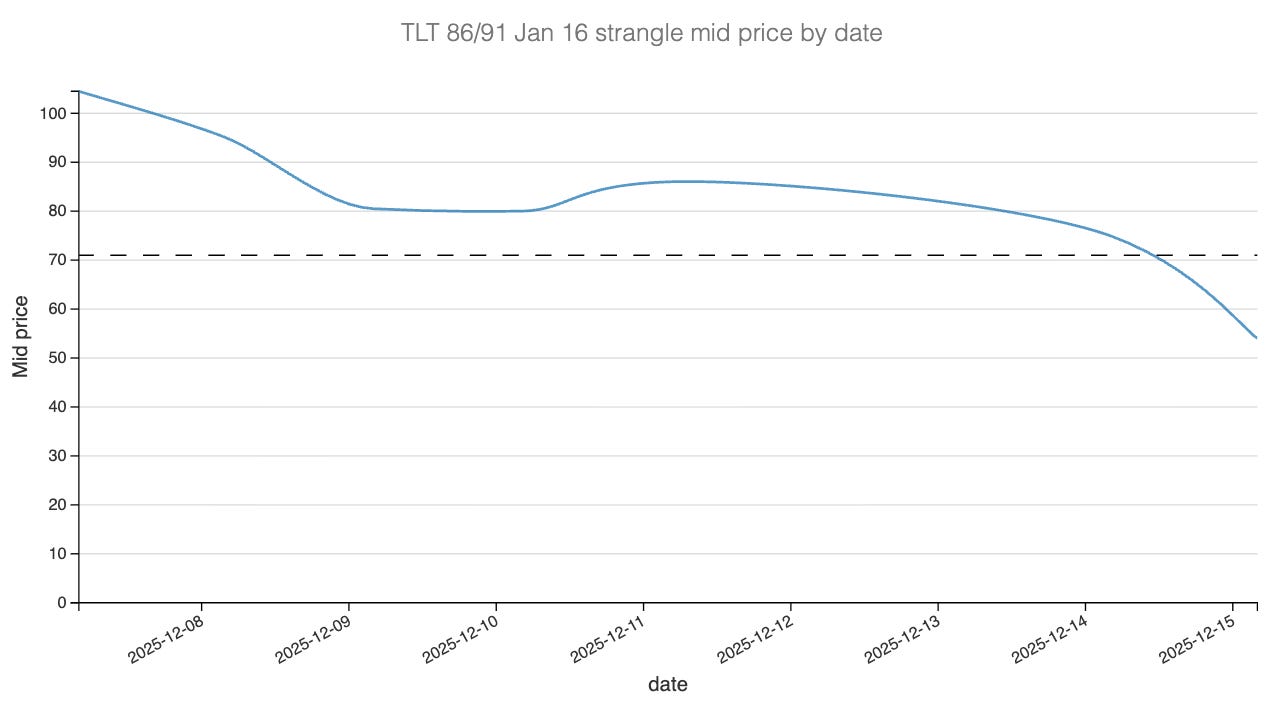
We entered with the group at 98cts, and you could have been filled better than that with some patience, and exited at 71cts. What is interesting in this chart is that after a quick initial drop, the trade spent several days going essentially nowhere before rolling over again early this week, right when we exited. Let us now turn to the Greek PnL attribution to understand exactly what happened.
The Greeks Decomposition
The PnL attribution confirms what we intuitively felt while managing the trade: this was a textbook short volatility outcome, with most of the gains coming from vega and theta, and very little coming from directional exposure.
Starting with vega, the bulk of the PnL was realized early in the lifecycle of the trade. As shown on the cumulative attribution chart, the initial compression in implied volatility accounted for a large share of the profits during the first two sessions. This is consistent with what we observed in real time: implied volatility started to bleed before the FOMC, a strong signal that the market was gradually pricing out tail risk. This early vega decay did most of the heavy lifting and effectively paid for the rest of the trade.
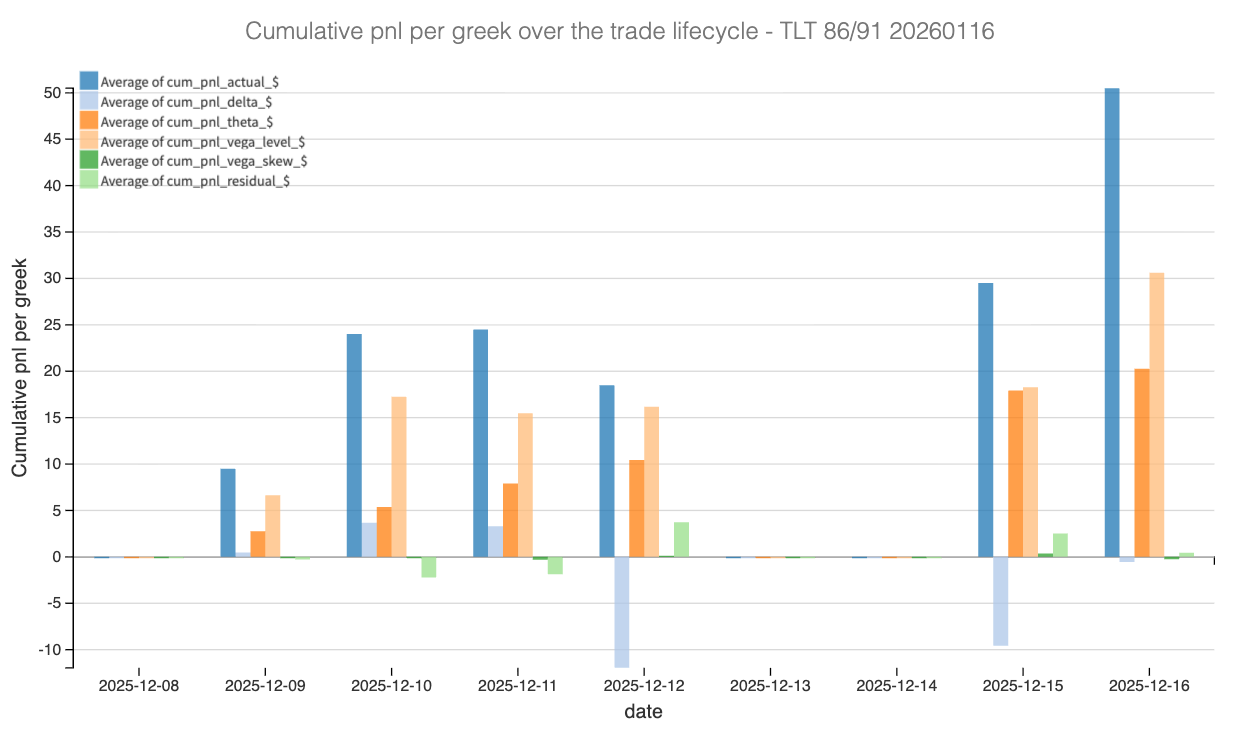
Theta then took over. Once implied volatility stabilized at lower levels, time decay became the dominant contributor. This explains the flat PnL profile observed for several days after the initial drop: nothing dramatic happened, but the clock kept working in our favor. This slow grind is exactly what we are looking for when selling volatility into a well-defined distribution.
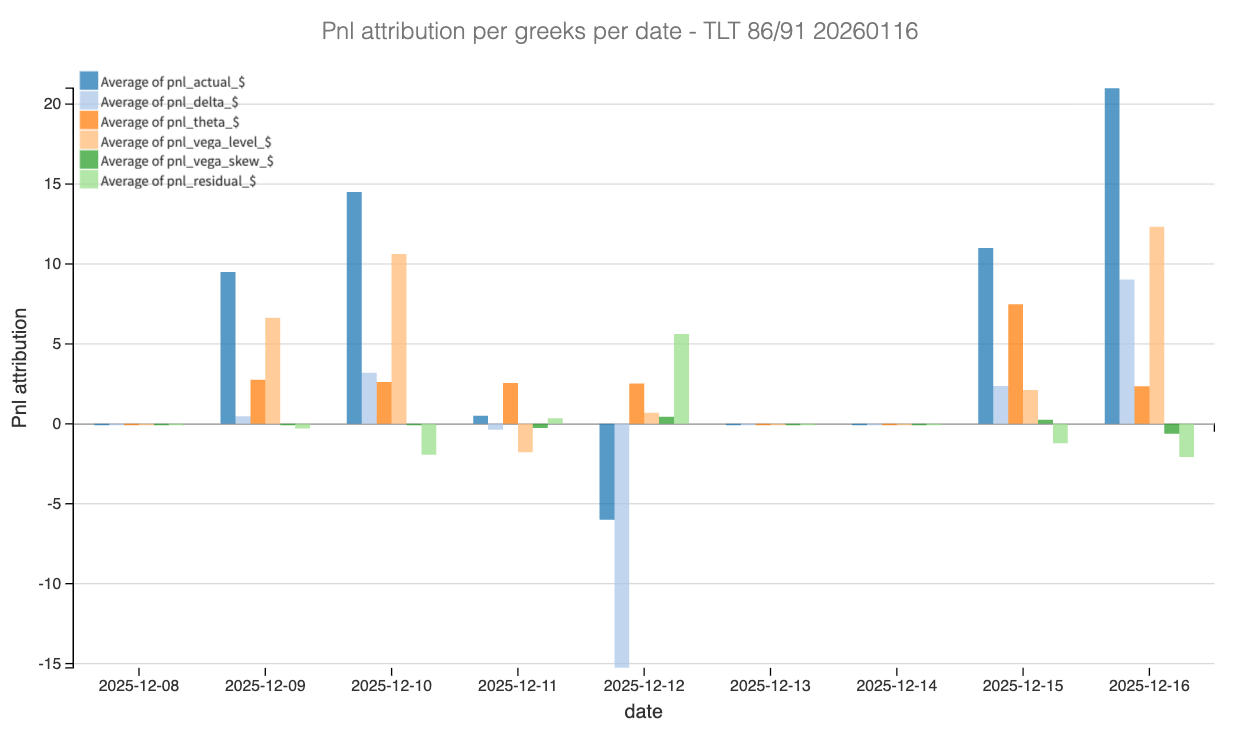
Delta, on the other hand, played a very minor role overall. Despite some intraday swings around the FOMC and the following session, TLT remained tightly anchored around the 88 strike. As a result, directional PnL oscillated but never threatened the position in a meaningful way. This highlights the importance of path dependency: the absence of trend mattered more than the absolute level of rates.
Finally, residual and skew-related components remained small and mostly noise-like. There was no meaningful repricing of the smile, nor any structural dislocation that would have altered the risk profile mid-trade.
In short, this trade delivered exactly what it was supposed to: early vega relief, followed by steady theta extraction, with delta risk staying comfortably contained.
This was our last review for 2025, we will definitely continue that series in 2026 due to popular demand. Do not forget to redeem your 40% discount on your yearly subscription, and to subscribe to our platform: as a reminder, the active plan gives you complementary access to the newsletter!
Enjoy the end of the year.
Ksander.