
Trade Anatomy - Short Vol in SMH
Post Mortem Signal du Jour 29/01/2026
Two weeks ago, we presented an opportunity to short volatility in SMH. We were anticipating a few remaining tech earnings and argued that the AI bubble narrative had failed to gain traction like it did in Q4 2025. Therefore, we concluded the coast was clear.
Well, things did end up “okay,” but it was quite a bumpy ride. Right after we published the article, the SLV drama unfolded alongside a renewed run on tech as investors grasped the implications of Anthropic’s amazing new product releases (Claude Code and Cowork). It didn’t take much for option demand to spike, mechanically driving implied volatility higher.
Clearly, the short vol thesis was wrong—or at least poorly timed. In a market driven by headlines where the next catalyst is just a tweet away, timing is becoming increasingly difficult. Yet, we ended up making money. Was this luck? Or was it simply the expression of what vol trading really is: selling insurance that is expensive relative to the actual risk realized over the life of the option?
That is what we will unpack in this article. Let’s dig in.
The trade
In our Signal Du Jour two weeks ago, we discussed shorting the 380/460 strangle in SMH for the March 6th expiration. At the time, we were fresh off the year's first FOMC meeting; implied volatility was elevated, and the probabilities looked favorable.

Our models indicated a 68% chance that the implied volatility we sold (around 36%) would exceed subsequent realized volatility, which sat at 29%. We anticipated implied volatility would cool off, providing a buffer even if realized volatility continued to climb.
Well, realized volatility did indeed climb, but implied volatility absolutely exploded.
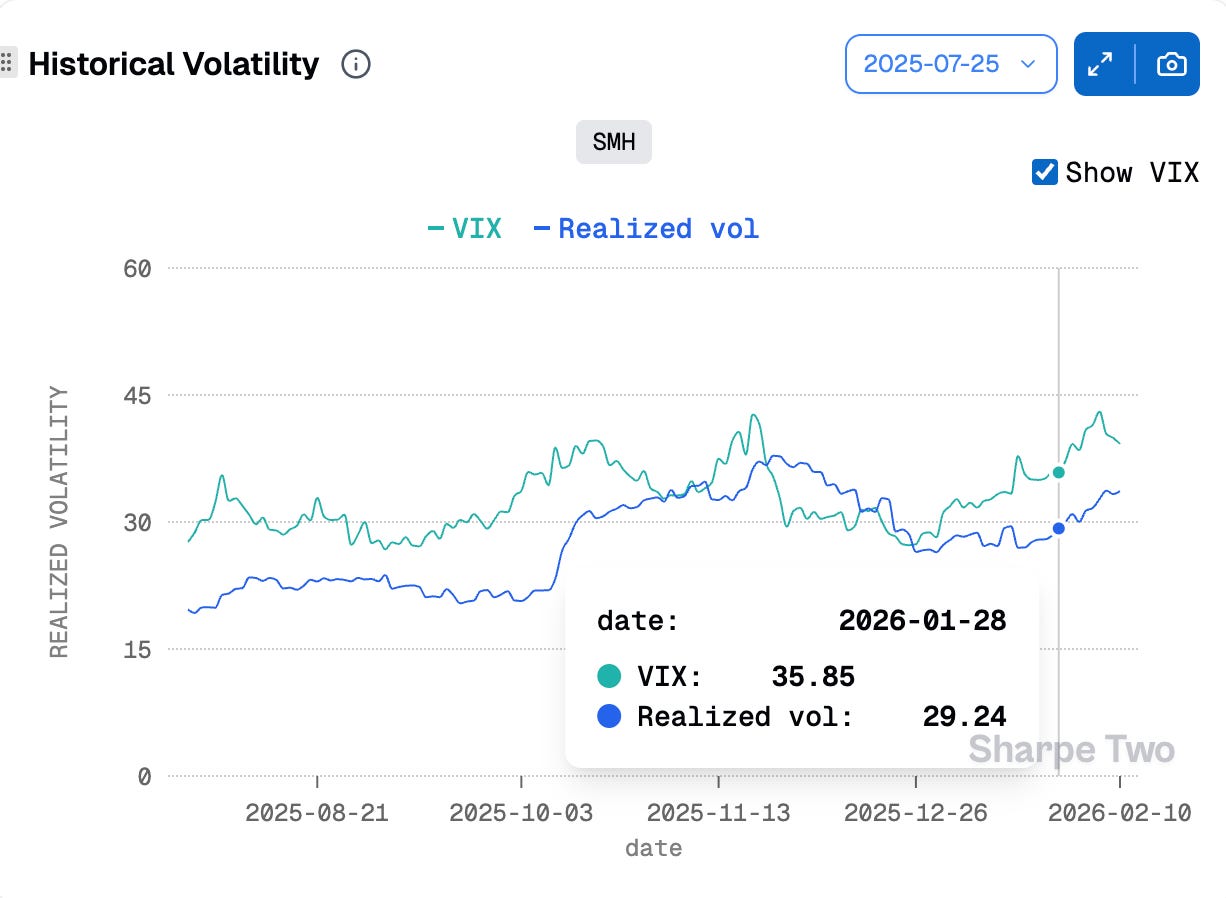
It shot from 36 to 44 in just a couple of days, inflicting serious damage on the PnL. This serves as a stark reminder that harvesting the variance risk premium is inextricably linked to delta risk. Managing whipsaws in the underlying is critical, especially when price action challenges your strikes. We often assume implied volatility will remain stable, but in the current high vol-of-vol regime (where the market overreacts to every headline) that assumption is increasingly dangerous.
And what about the directional risk?
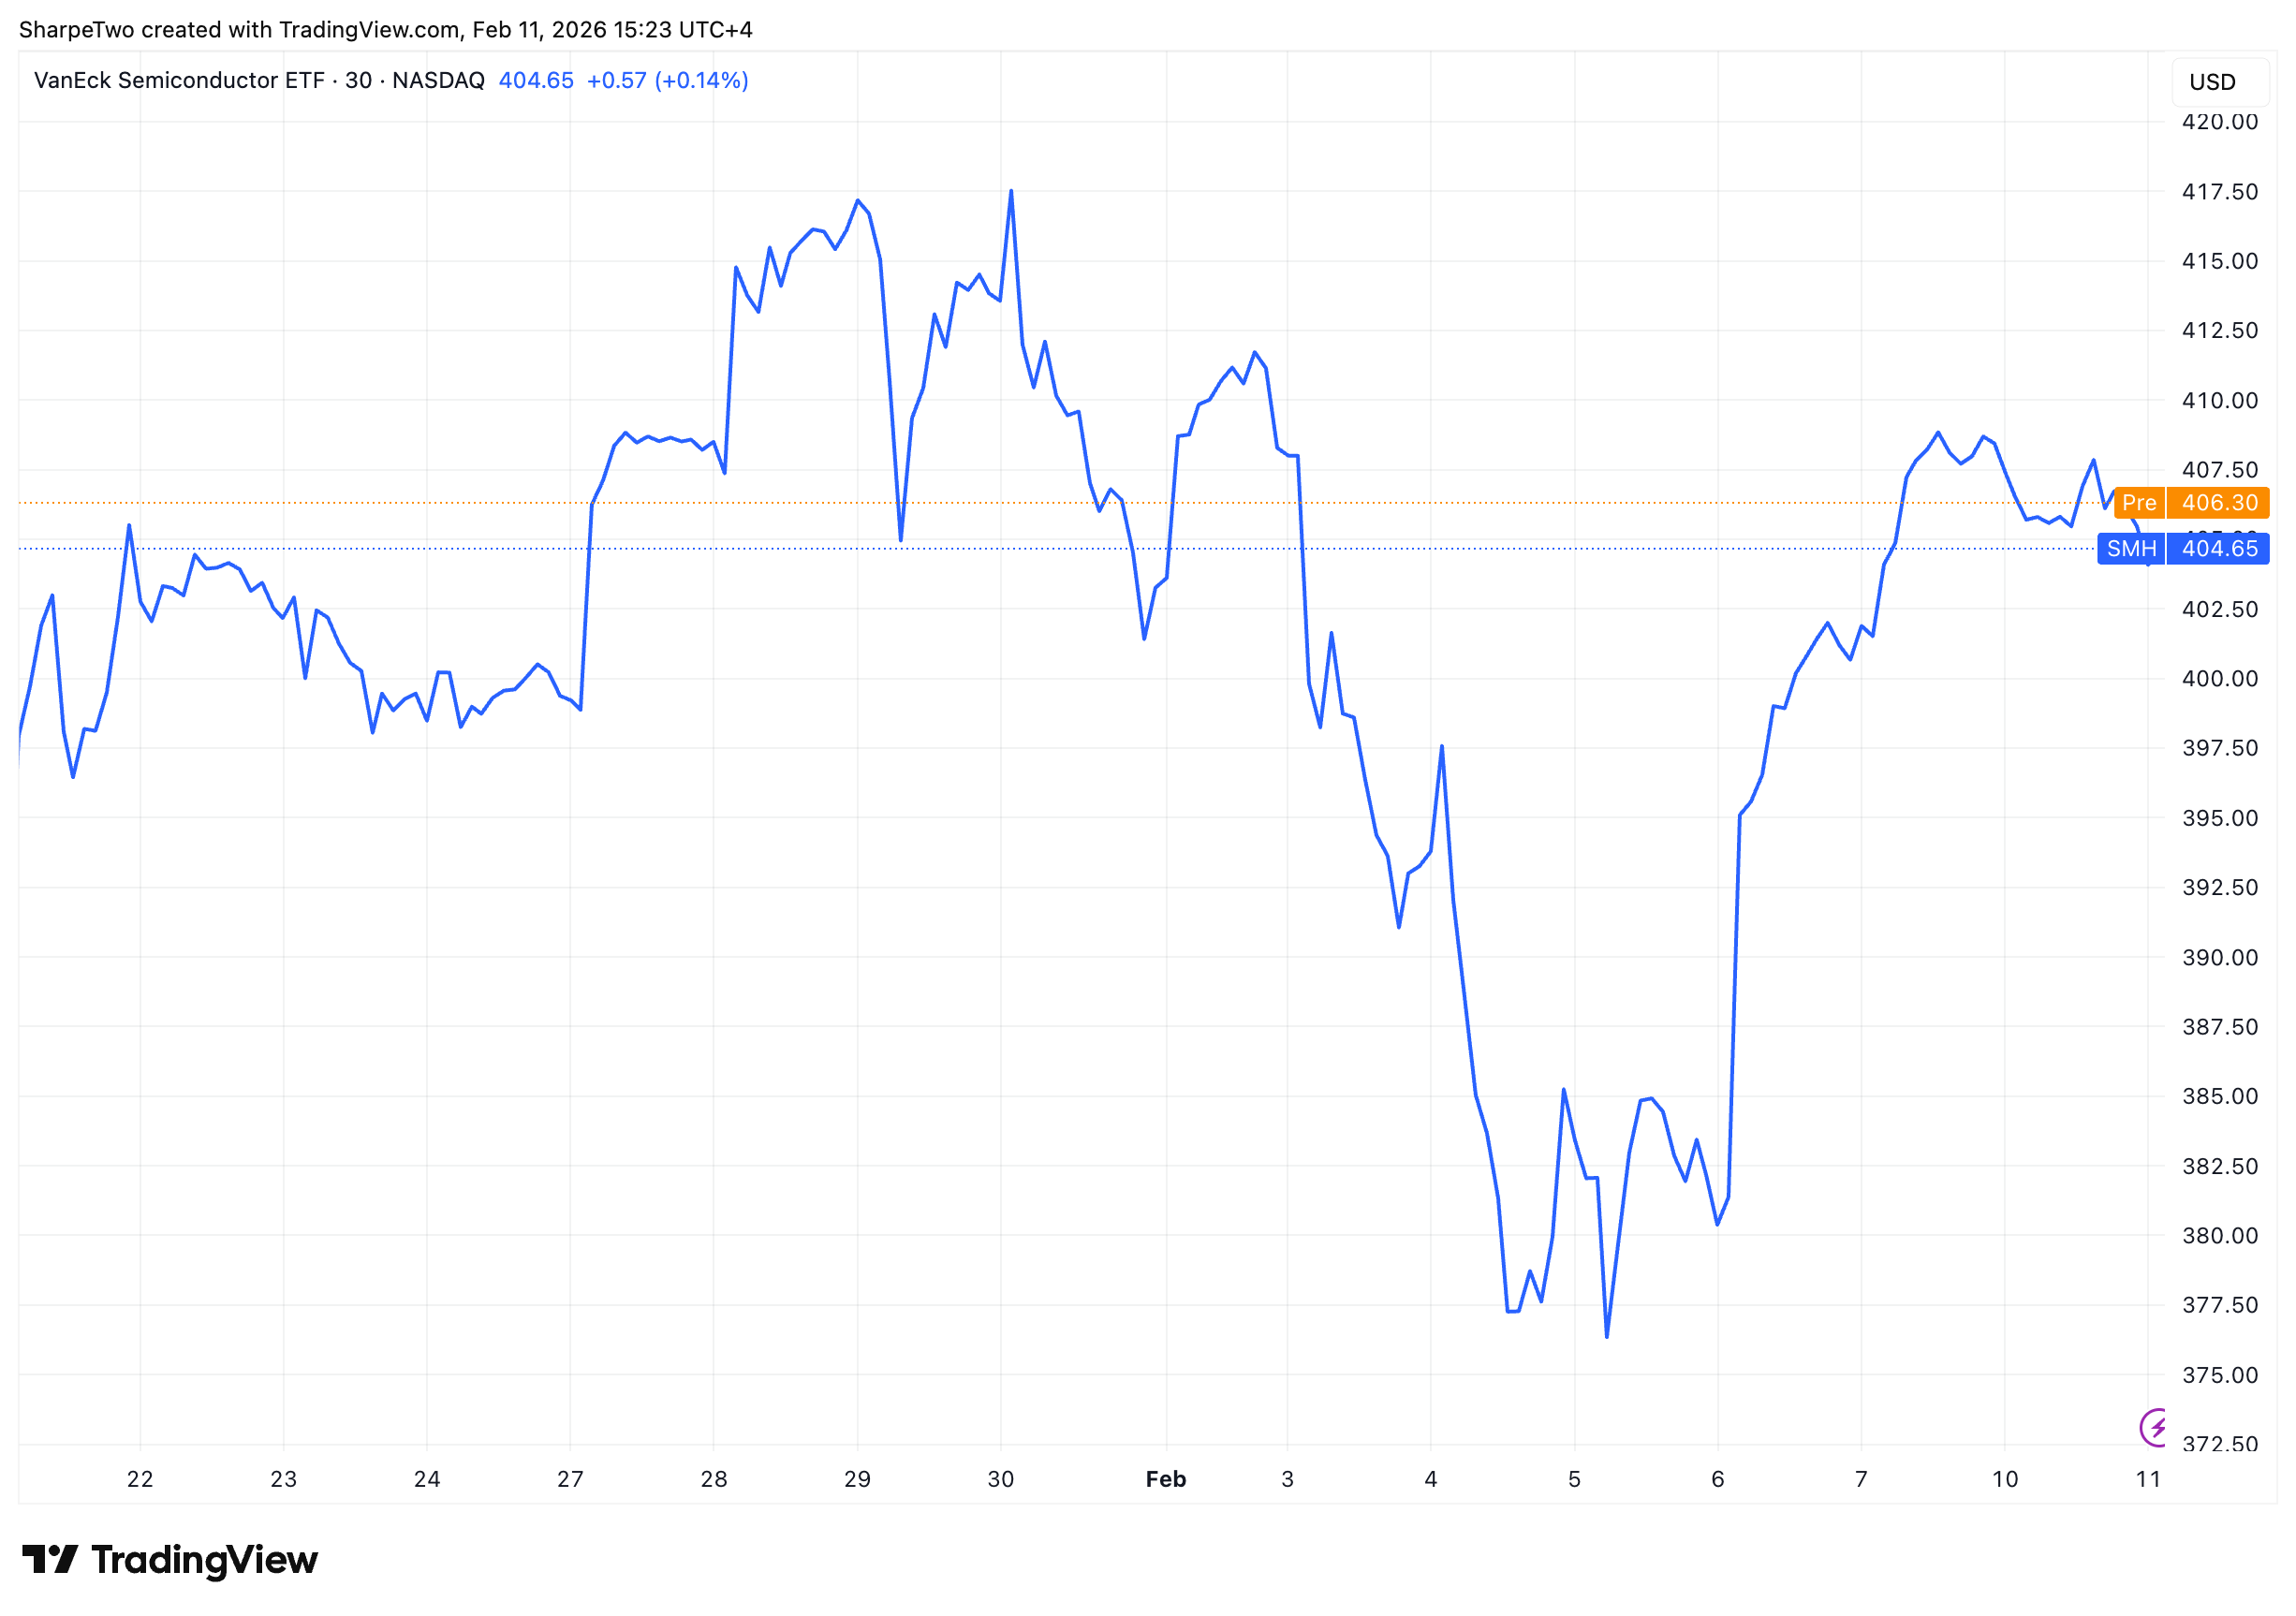
It was a rough patch, to say the least. As is typical in the tech sector, spikes in implied volatility often accompany violent downside moves. This time was no different: SMH lost about 5% between our entry and the peak of the volatility expansion last week, crashing right onto our put strike. Fortunately, as broader market volatility cooled, the underlying recovered, and our position improved.
In terms of the two main PnL drivers, the trade failed. At that stage, whatever happened next must be attributed to luck. Realized volatility climbed dangerously close to our sold implied levels, and our strikes were tested. That is enough to invalidate the thesis. This is where small sizing saves you: sometimes variance strikes on the bad side, and sometimes... on the good side.
Although the trade was severely underwater by the middle of the following week, it clawed back to scratch by Friday as market volatility cooled. Over the last few days, with no major news to disrupt the theta burn, it turned positive.
We will definitely take the luck; it doesn’t always end this well. But the moral of the story is that you have to create your own luck. Trading too big would have forced a liquidation at arguably the worst possible moment, right before the mean reversion occurred.
Another crucial lesson is the importance of back-month hedges. Filled with Vega and suffering less time decay, they provide a vital cushion during unexpected volatility spikes.
Let’s now look into the Greek decomposition.
The Greek decomposition
Looking at the attribution, the story of this trade is a dramatic tug-of-war: it was a battle where Theta had to work overtime to dig the position out of a deep hole dug by Delta and Vega.
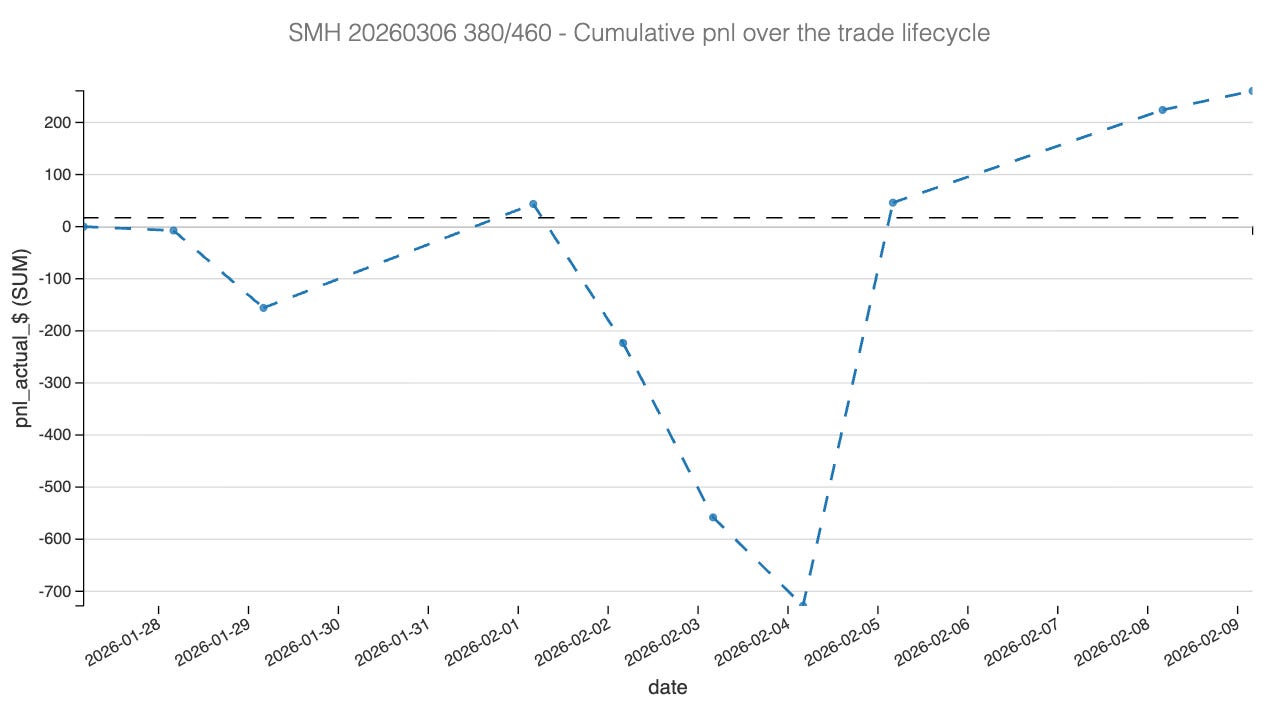
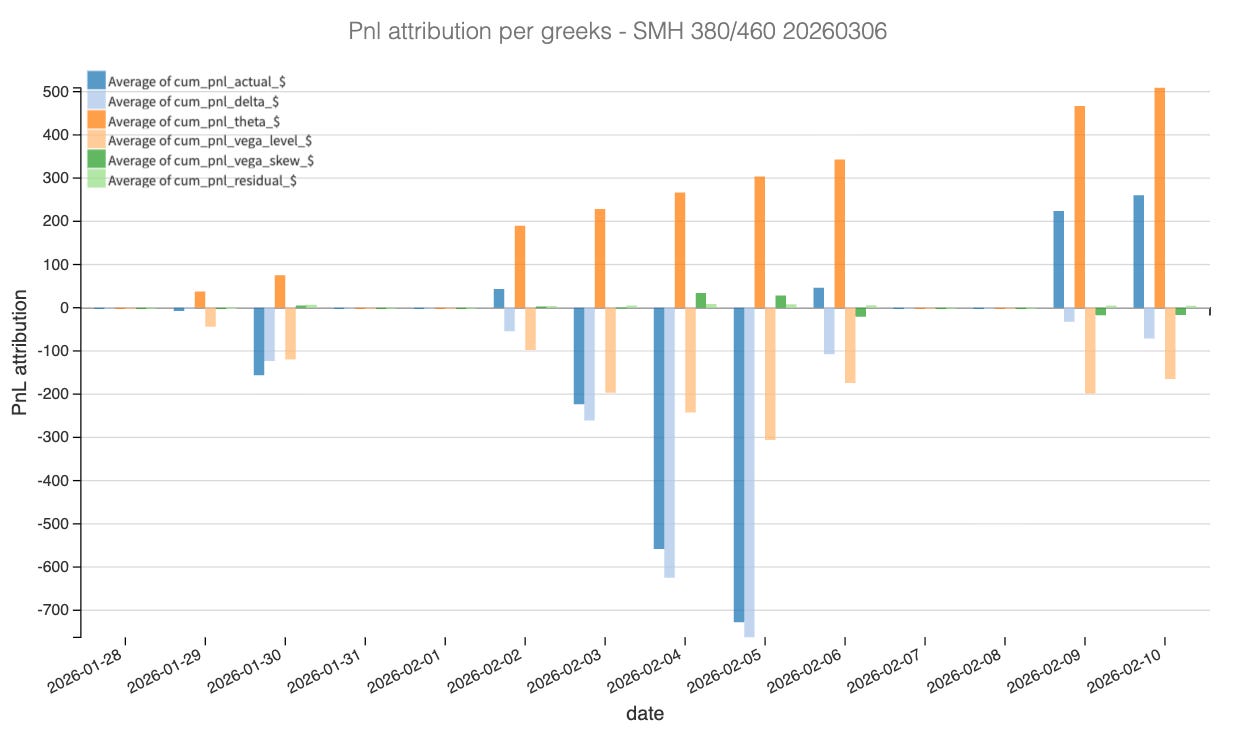
As illustrated in the cumulative PnL chart, the equity curve is far from the smooth upward slope we like to see in these setups. Instead, it shows a violent V-shape recovery. Throughout the trade, Theta (time decay) acted as the reliable engine, illustrated by the orange bars steadily stacking up. Regardless of the chaos in the market, the passage of time chipped away at the premium, accumulating a buffer that would ultimately save the trade.
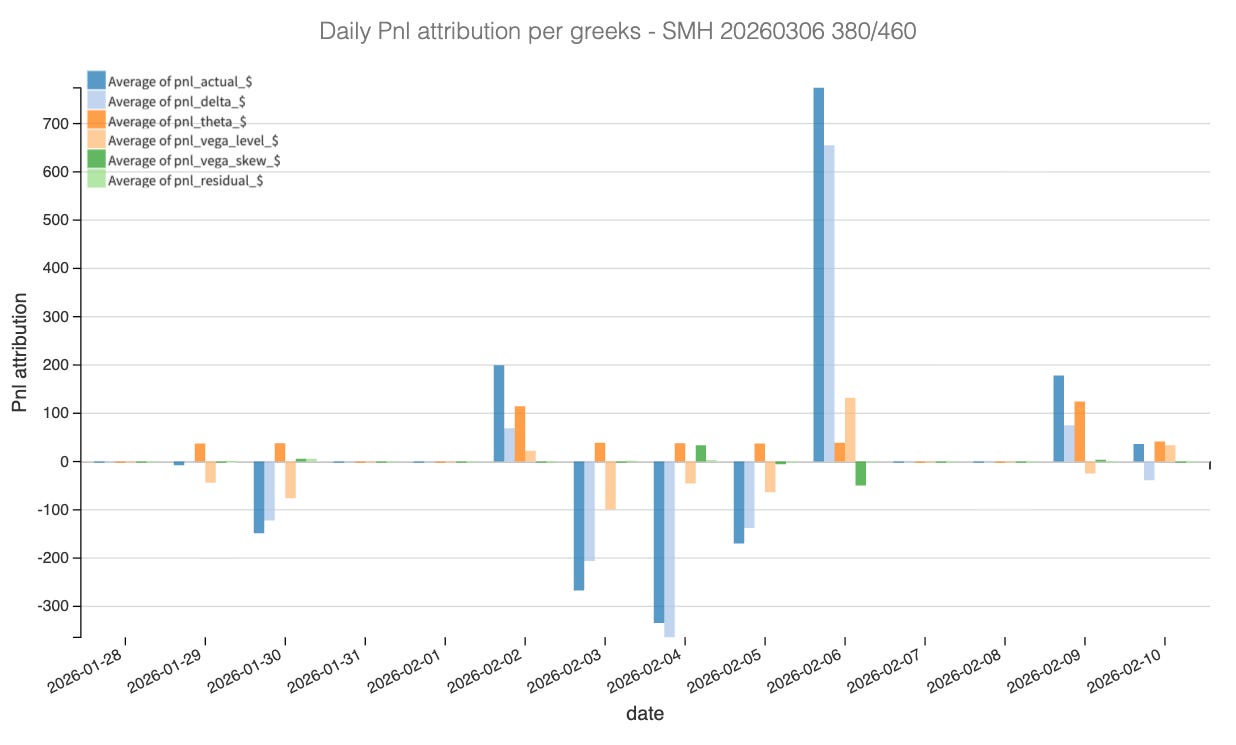
However, the middle of the trade reveals where the stress came from. Unlike the TLT example from last week where Vega was supportive, here Vega and Delta combined forces to act as a massive headwind. As seen in the daily attribution on February 4th and 5th, the light blue bars (Delta) show a massive drag. This corresponds to the 5% drop in SMH that sent the price crashing into our 380 put strike. Simultaneously, the yellow bars (Vega) turned negative as implied volatility expanded from 36 to 44. We were fighting on two fronts: directional risk and a repricing of the variance premium.
The cumulative chart highlights just how precarious the situation became around February 5th, where the combined weight of the Delta losses (reaching roughly -$650) and Vega expansion dragged the total PnL severely underwater. The trade only turned profitable because the market stabilized: as the panic subsided, the directional pressure eased (Delta recovery) and implied volatility finally mean-reverted, allowing the accumulated Theta to become the dominant factor once again.
In summary, while we walked away with a profit, the attribution makes it clear this was a “survival” trade rather than a clean harvest. It serves as a reminder that when Delta and Vega move against you simultaneously, Theta is often your only line of defense.
Now the big question: to roll or not to roll? Let’s have a look at what the data says
