
Trade anatomy - short strangle in IYR
Post mortem analysis for the 2025/09/04 Signal du Jour.
Two weeks ago, we wrote in depth about IYR. It was right after the market came back from the long Labor Day weekend, with the VIX spiking and everyone wondering what September would really look like. We are still waiting for the main event of the quarter—the most anticipated FOMC of the year—but so far, realized volatility has not followed through.
That calm surely helped us post yet another profitable trade. But the purpose of this series is not to boast about results (time will tell whether there is true edge in our data) but to check whether P&L came from the places we expected in the first place.
The beauty—and the curse—of options trading is that you can be wrong and still make money. When that happens, it is pleasant, but it is better to recognize it and adjust.
Let us see if that was the case here.
The trade
We were eyeing a short strangle in IYR with the October 3rd expiration, looking at the 91 strike on the put side and 99 on the call side. At the time, IYR was trading just under 96, with implied volatility at 9 days of 15.3 and realized at 11.2.

Still, we chose to strike the trade at 30 days, aiming to avoid potential whipsaws in the front weeks and to let the strangle bleed as time passed, assuming realized volatility did not pick up.

The odds were not as attractive as the 9-day horizon, and the VRP at 30 days was flat. But that was a trade-off we were comfortable with. First, the intention was never to hold for 30 full days. Second, risk management comes first: heading into a busy FOMC period, the last thing we wanted was to nurse near-expiration positions that had turned painful after a sudden market spike.
We were reasonably confident that the implied volatility sold that day would not be exceeded by realized volatility over the next 30 days, even with a strong conviction (86%) that realized could rise.
Finally, a deeper look at the volatility surface suggested that the edge was mostly on the put side. If anything, the call needed hedging. To cover that, we also bought the 91/100 risk reversal expiring October 17. We will leave this one out of the equation—spoiler alert, it made money—and keep the focus on the strangle.
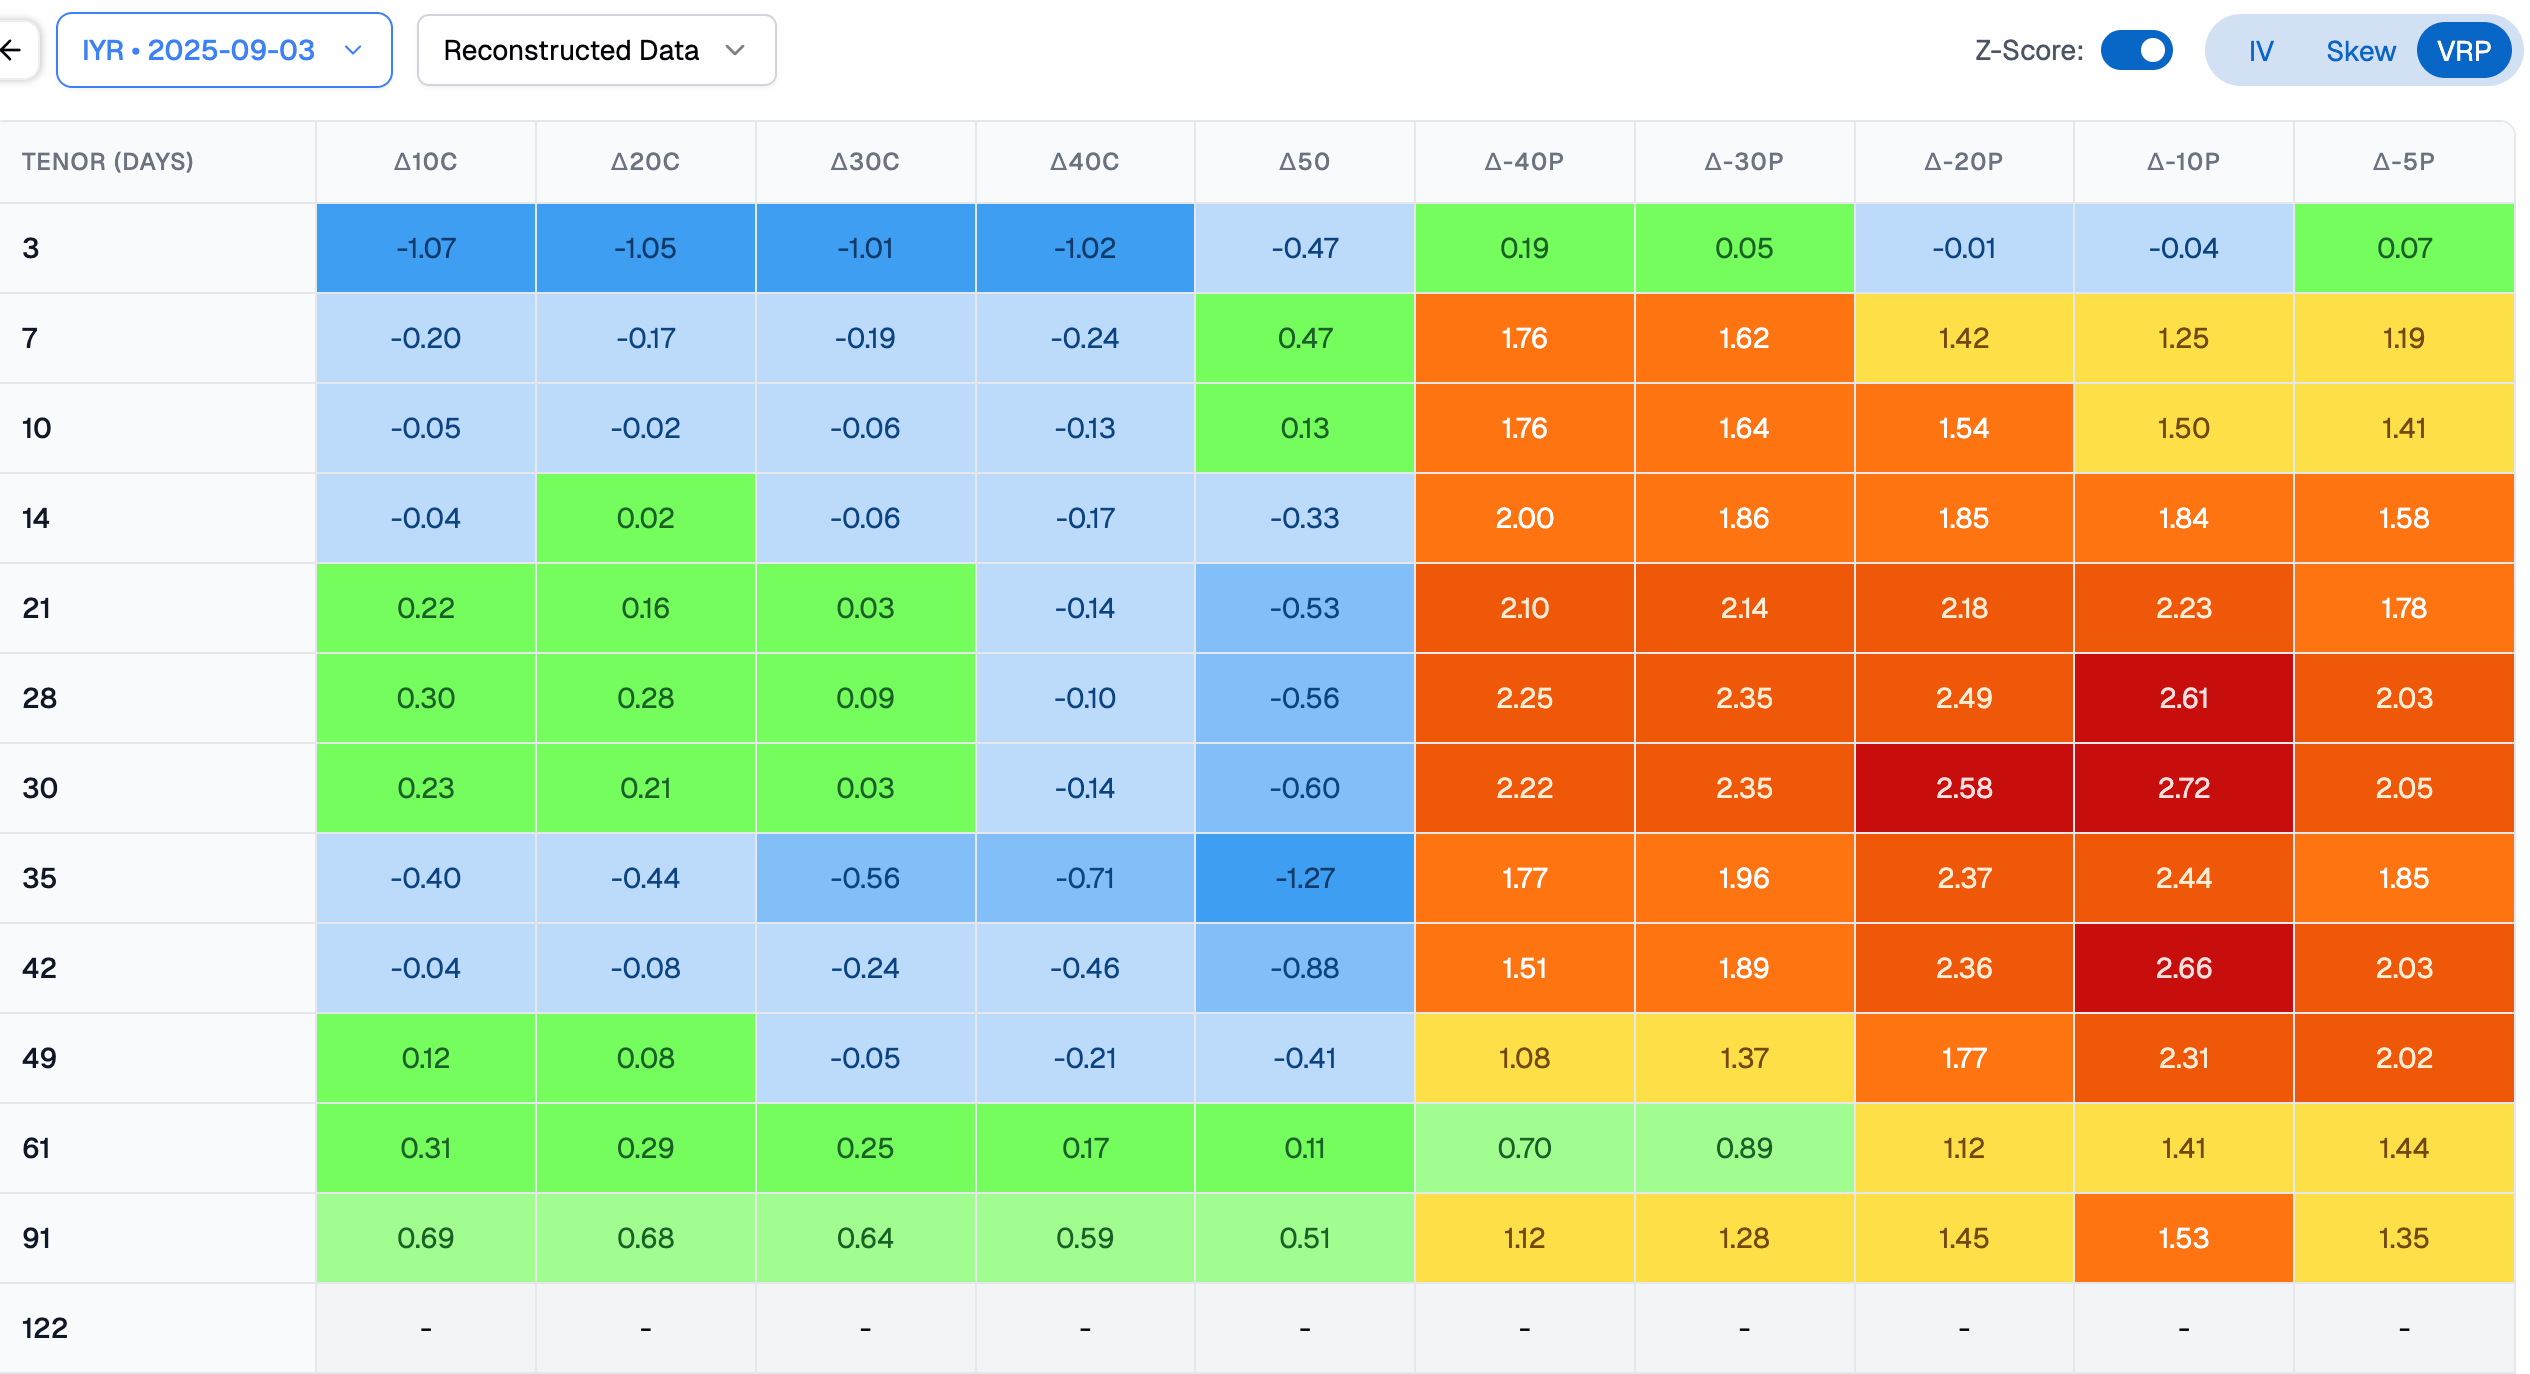
Let us begin by reviewing how realized volatility behaved over the last two weeks. We expected it could rise, but our thesis was that it would not exceed 15.2 over the next nine days.
It is clear that the realized volatility over the period was not nearly enough to dent the margin embedded in the VRP.
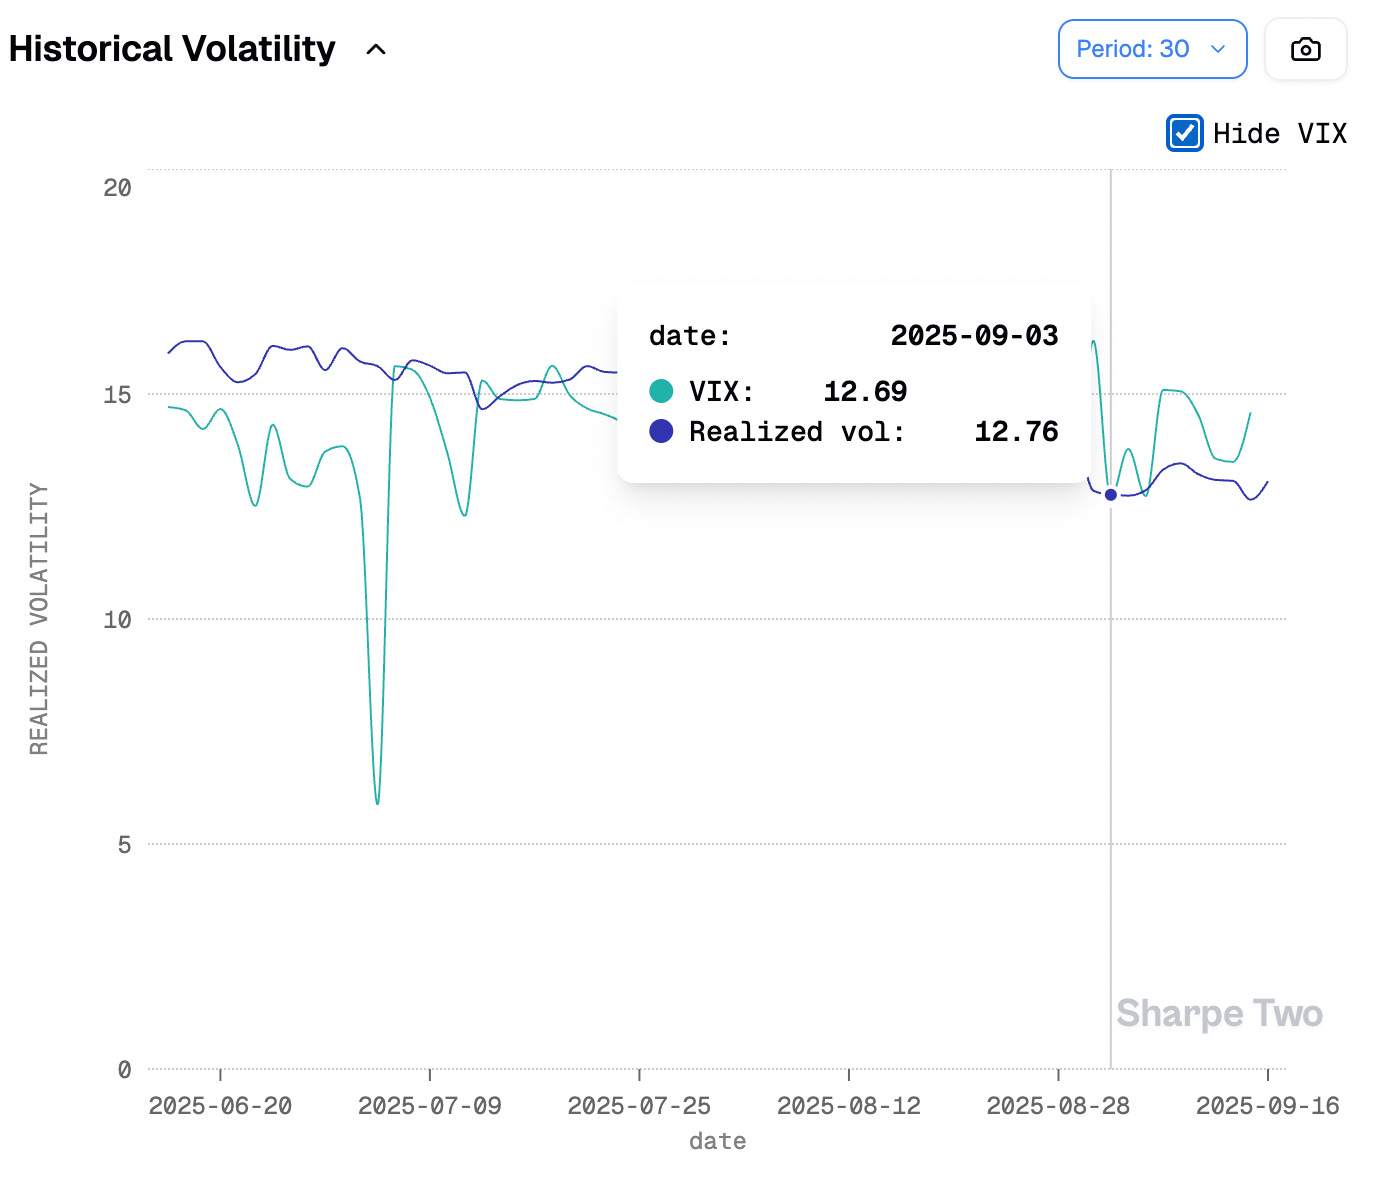
And indeed, realized ticked slightly higher, particularly in the run-up to the FOMC as the market reacted to NFP and CPI data, but nothing meaningful. The 30-day RV went from 11.2 to just above 12, while implied also rose during the period. That last part is interesting, because it meant potential losses on the vega side. More on that in a minute.
Overall, the underlying drifted higher as the “bad news is good news” narrative around the macro environment was digested. The 99 calls were tested at one point, but the risk reversal hedge would have made the position far more palatable.
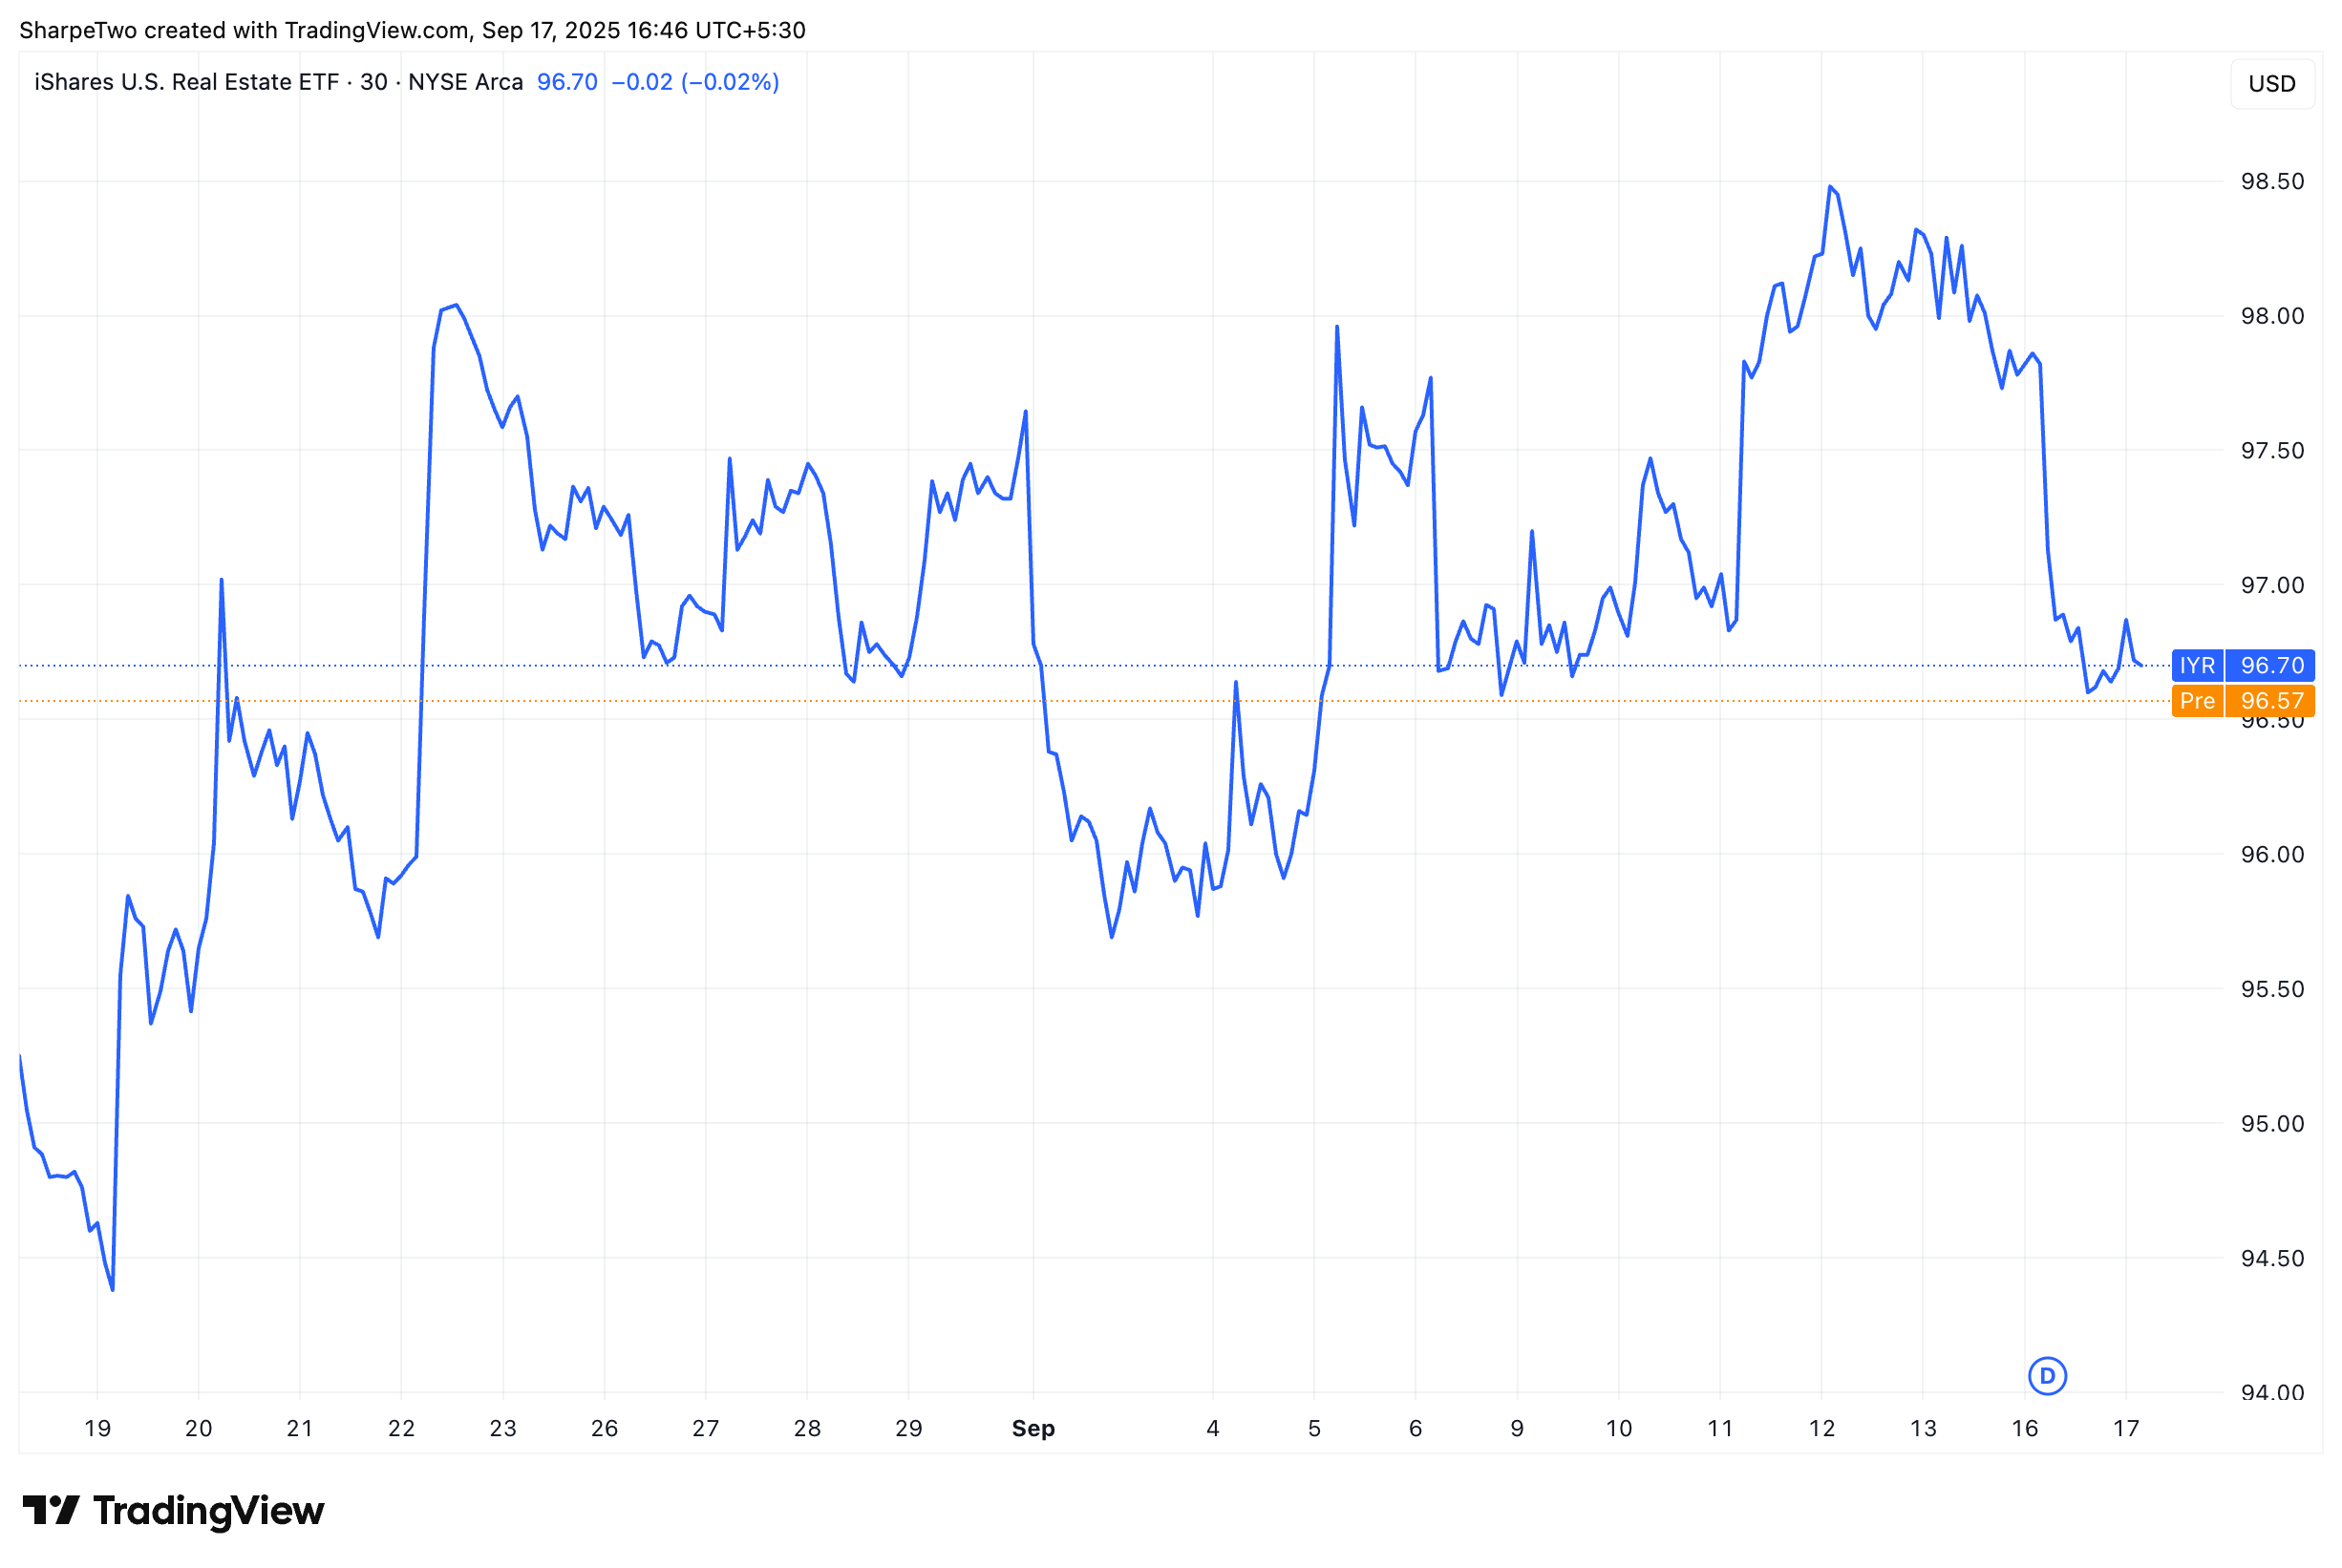
By the end, the index was roughly 1% above where we started, which meant we should not expect to lose much on the delta side.
And indeed, when tracking the strangle’s price over time, it dipped negative briefly before reverting back into positive territory.
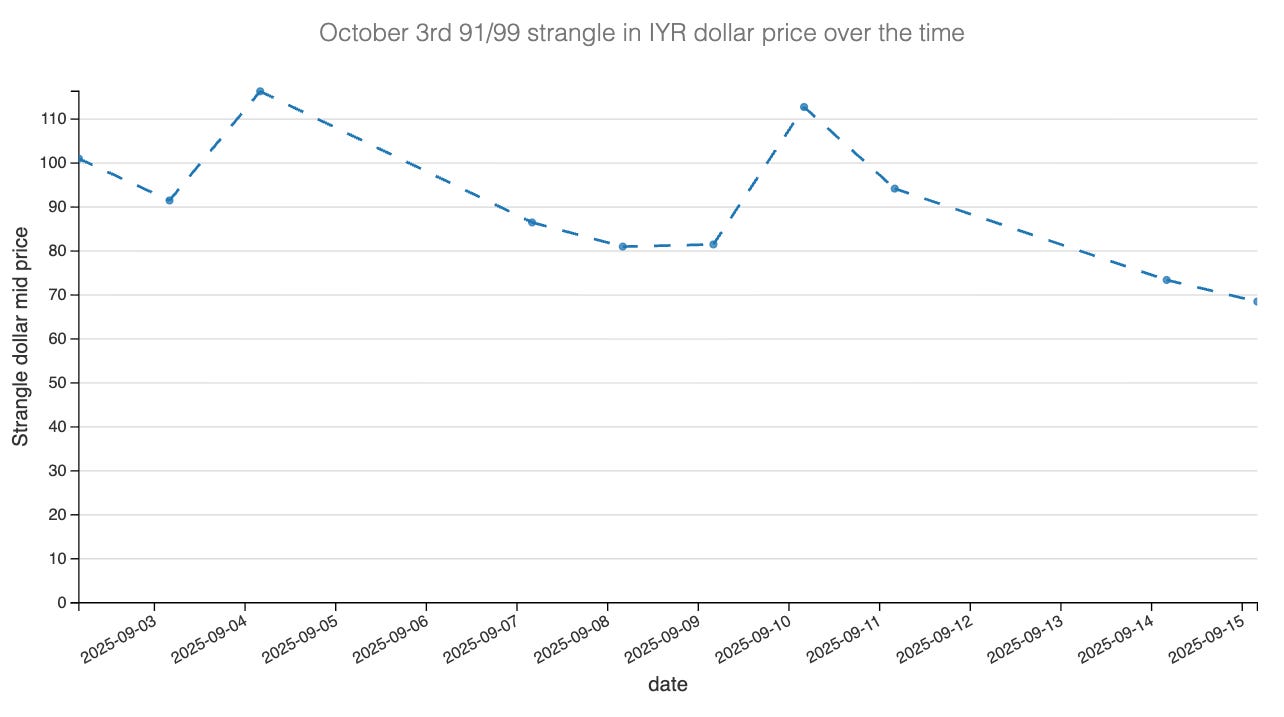
So was this luck? There is always some element of luck in variance trading, especially when you do not delta hedge. You accept that randomness may dictate a path with very little variance realized, yet ending far outside your strikes. Our assumption is that these market situations even themselves out over time.
Now let us look at each P&L component in more detail.
The greeks decomposition
We decomposed the short 91P/99C IYR strangle day by day using end-of-day mids and dollar-Greeks. Buckets: delta drift, theta carry, vega level (parallel IV moves), vega skew (put/call shape), and a small residual for higher-order/path effects. No delta hedging and therefore gamma lives inside delta and residual.
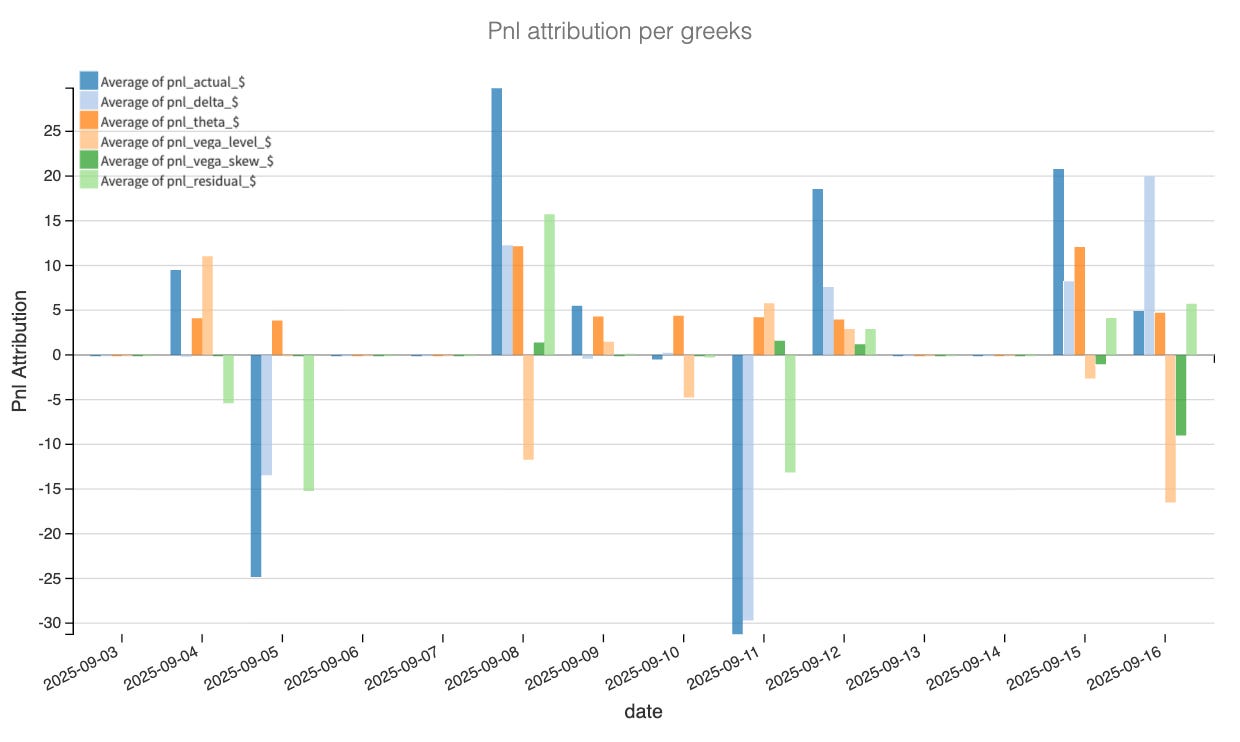
The story is straightforward and similar to last week, theta did the work. While the number of days to expiration bled from 30 toward the low 20s, realized stayed contained and the clock paid us most sessions. That was the thesis: collect carry without needing a heroic vol call.
We also knew that implied level could potentially be a headwind and as expected, IV rose as move into CPI/NFP/FOMC, IV lifted. Those negative vega are particularly prevalent on days pre CPI and … pre FOMC. Once that passed, the drag faded.
Volatility skew was a sideshow and the relative repricing of puts vs calls netted close to zero. There weren’t any meaningful skew event, which matches our read of the surface at entry. In fact, yesterday showed quite a bit of demand for calls which impacted our pnl quite a bit.
Ultimately, this analysis shows this was never a “short the crush” idea—just earn rent while IV wiggles and time passes are market wait and digest the news as they arrive.
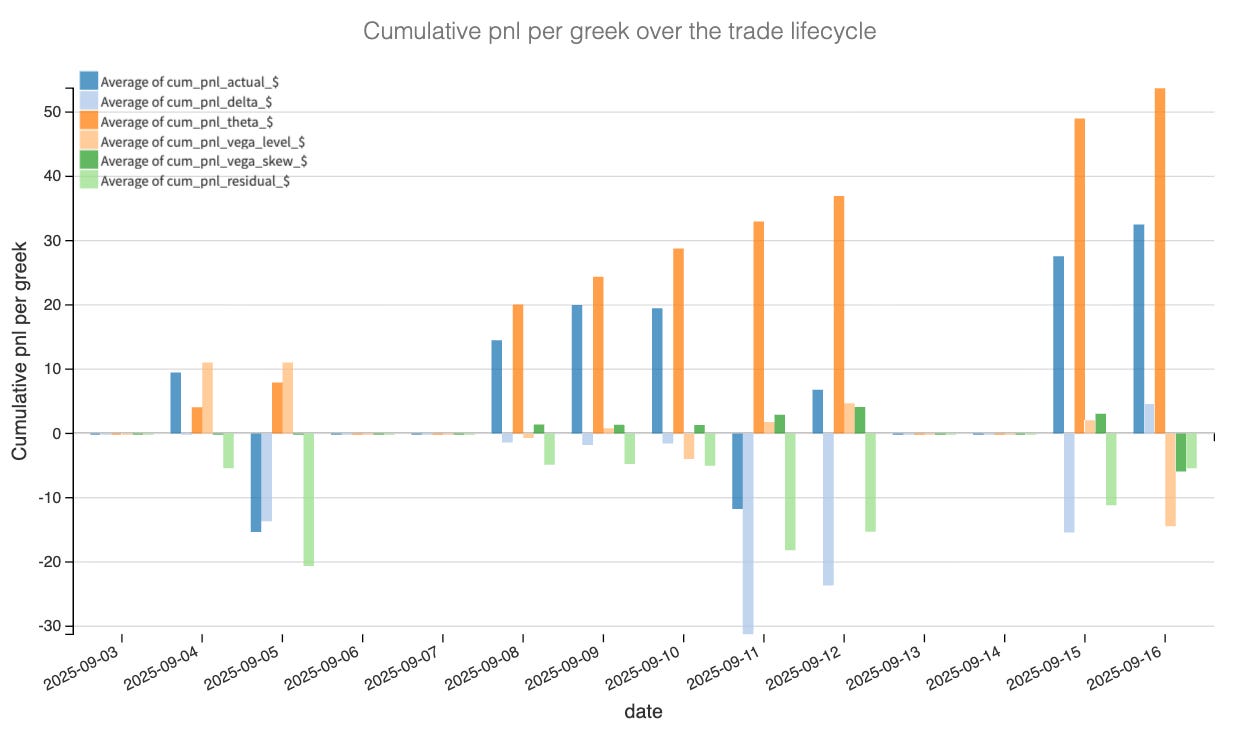
Residual spikes are path, not pathology. The big green/red days are gamma/vanna/vomma and microstructure showing through because we didn’t hedge intraday (plus a touch of parity/mark noise). If residuals were running the show, we’d worry but as we can see on the cumulative pnl chart, they aren’t.
Net-net: the P&L came from where we said it would—mostly theta, a modest assist from delta, manageable vega bumps, minimal skew. Those are the fingerprints you want from a short-vol carry trade.
Now the big question - is there still enough edge in this trade to consider pushing it a few weeks from there and continue harvesting the VRP in the front weeks?
Let’s have a look.
