First of all, we wish you a very happy 2025! May health, happiness, and steady profitability guide you through what promises to be an eventful year. We’re honored to share this journey with you, and as we did last year, we’ll strive to highlight market situations that appear imbalanced—those rare setups where our chances of success rise significantly above the average.
Wherever you are reading this, winter has undoubtedly settled over the northern hemisphere. For many, this means bundling up in coats, braving the cold, and keeping warm with coal—or better yet, gas, but not Russian anymore if you’re in Europe.
While we took a few days off to close out the year, we couldn’t help but notice the rally in natural gas that marked the final stretch of December. There are several potential explanations for why it played out this way, but as option traders, our focus naturally shifts to the opportunities this movement has revealed. One in particular stood out: UNG, the ETF tracking natural gas futures.
This setup has grabbed our attention, and we think it’s worth diving into.
Let’s dig in.
The trigger? Hard to say, and since we’re not commodities experts, we’ll steer clear of speculating on factors we don’t fully understand. However, a few noteworthy points emerged: Some traders highlighted that a new weather model predicted an exceptionally cold January, which could have contributed to the price surge. Additionally, Europe’s formal goodbye to Russian gas on January 1st might have added fuel to the fire. While the exact cause remains uncertain, what we can confidently observe is the dramatic spike in realized volatility. Even though the frenzy cooled slightly by Monday’s close and throughout Tuesday, volatility remained notably elevated.
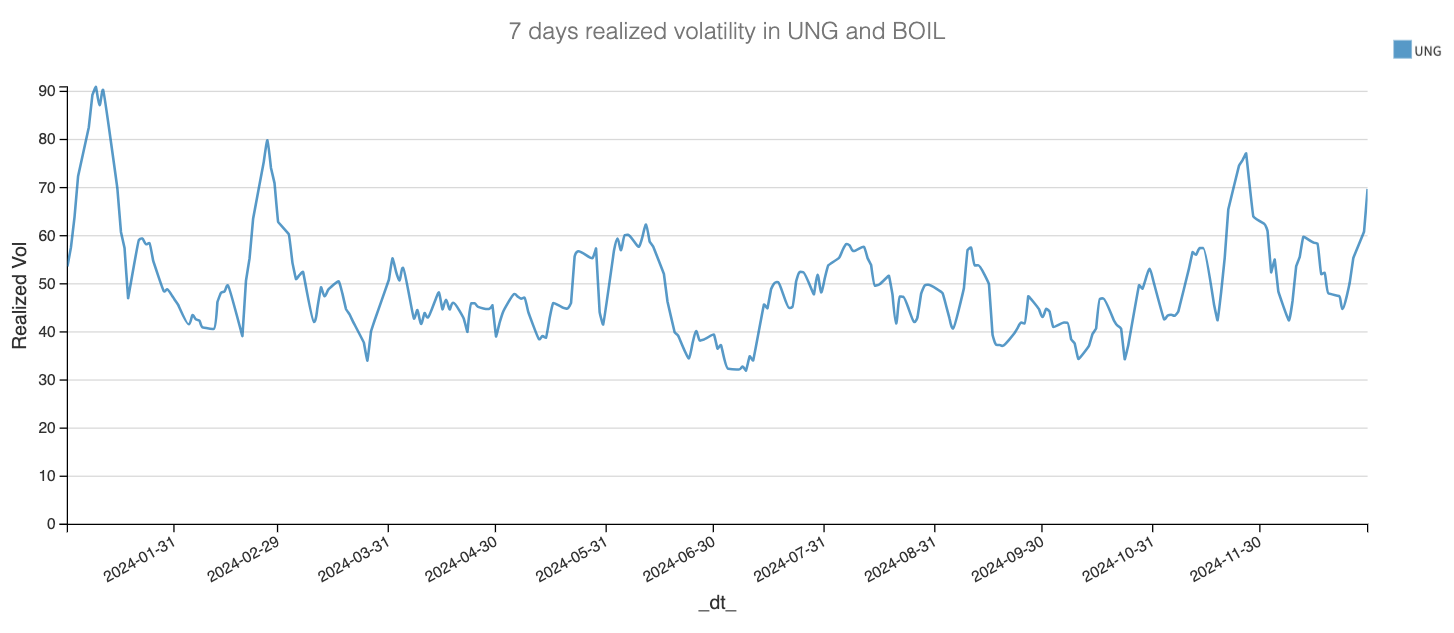
From 45% realized volatility over seven days to 70%—quite the spike, and eerily similar to the move we saw exactly a year ago when realized volatility jumped from 55% to 90% before pulling back. If we were to venture a prediction, our models are signaling another volatile week ahead and a January that could surpass December in terms of turbulence.