
Signal Du Jour - XLB - Sharpe 2.14 Win Rate 63%
Markets on a high; we looked into chemicals.
In November, we witnessed a broad appreciation across all asset classes. Investors, growing more confident about the Fed's interest policy, scooped up bonds, driving their rates down. Gold hit a record high, trading above $2100 an ounce. Meanwhile, the S&P 500 is inching closer to its all-time high, 5% away, and even Bitcoin is gearing up for a new bull run.
So, all is well in the world, Charlie?
At Sharpe Two, we typically steer clear of market commentary. Plenty of experts are out there, and our opinion is just one among many.
However, we can't help but notice the market's current euphoric state. It seems to be overestimating future prospects in certain areas.
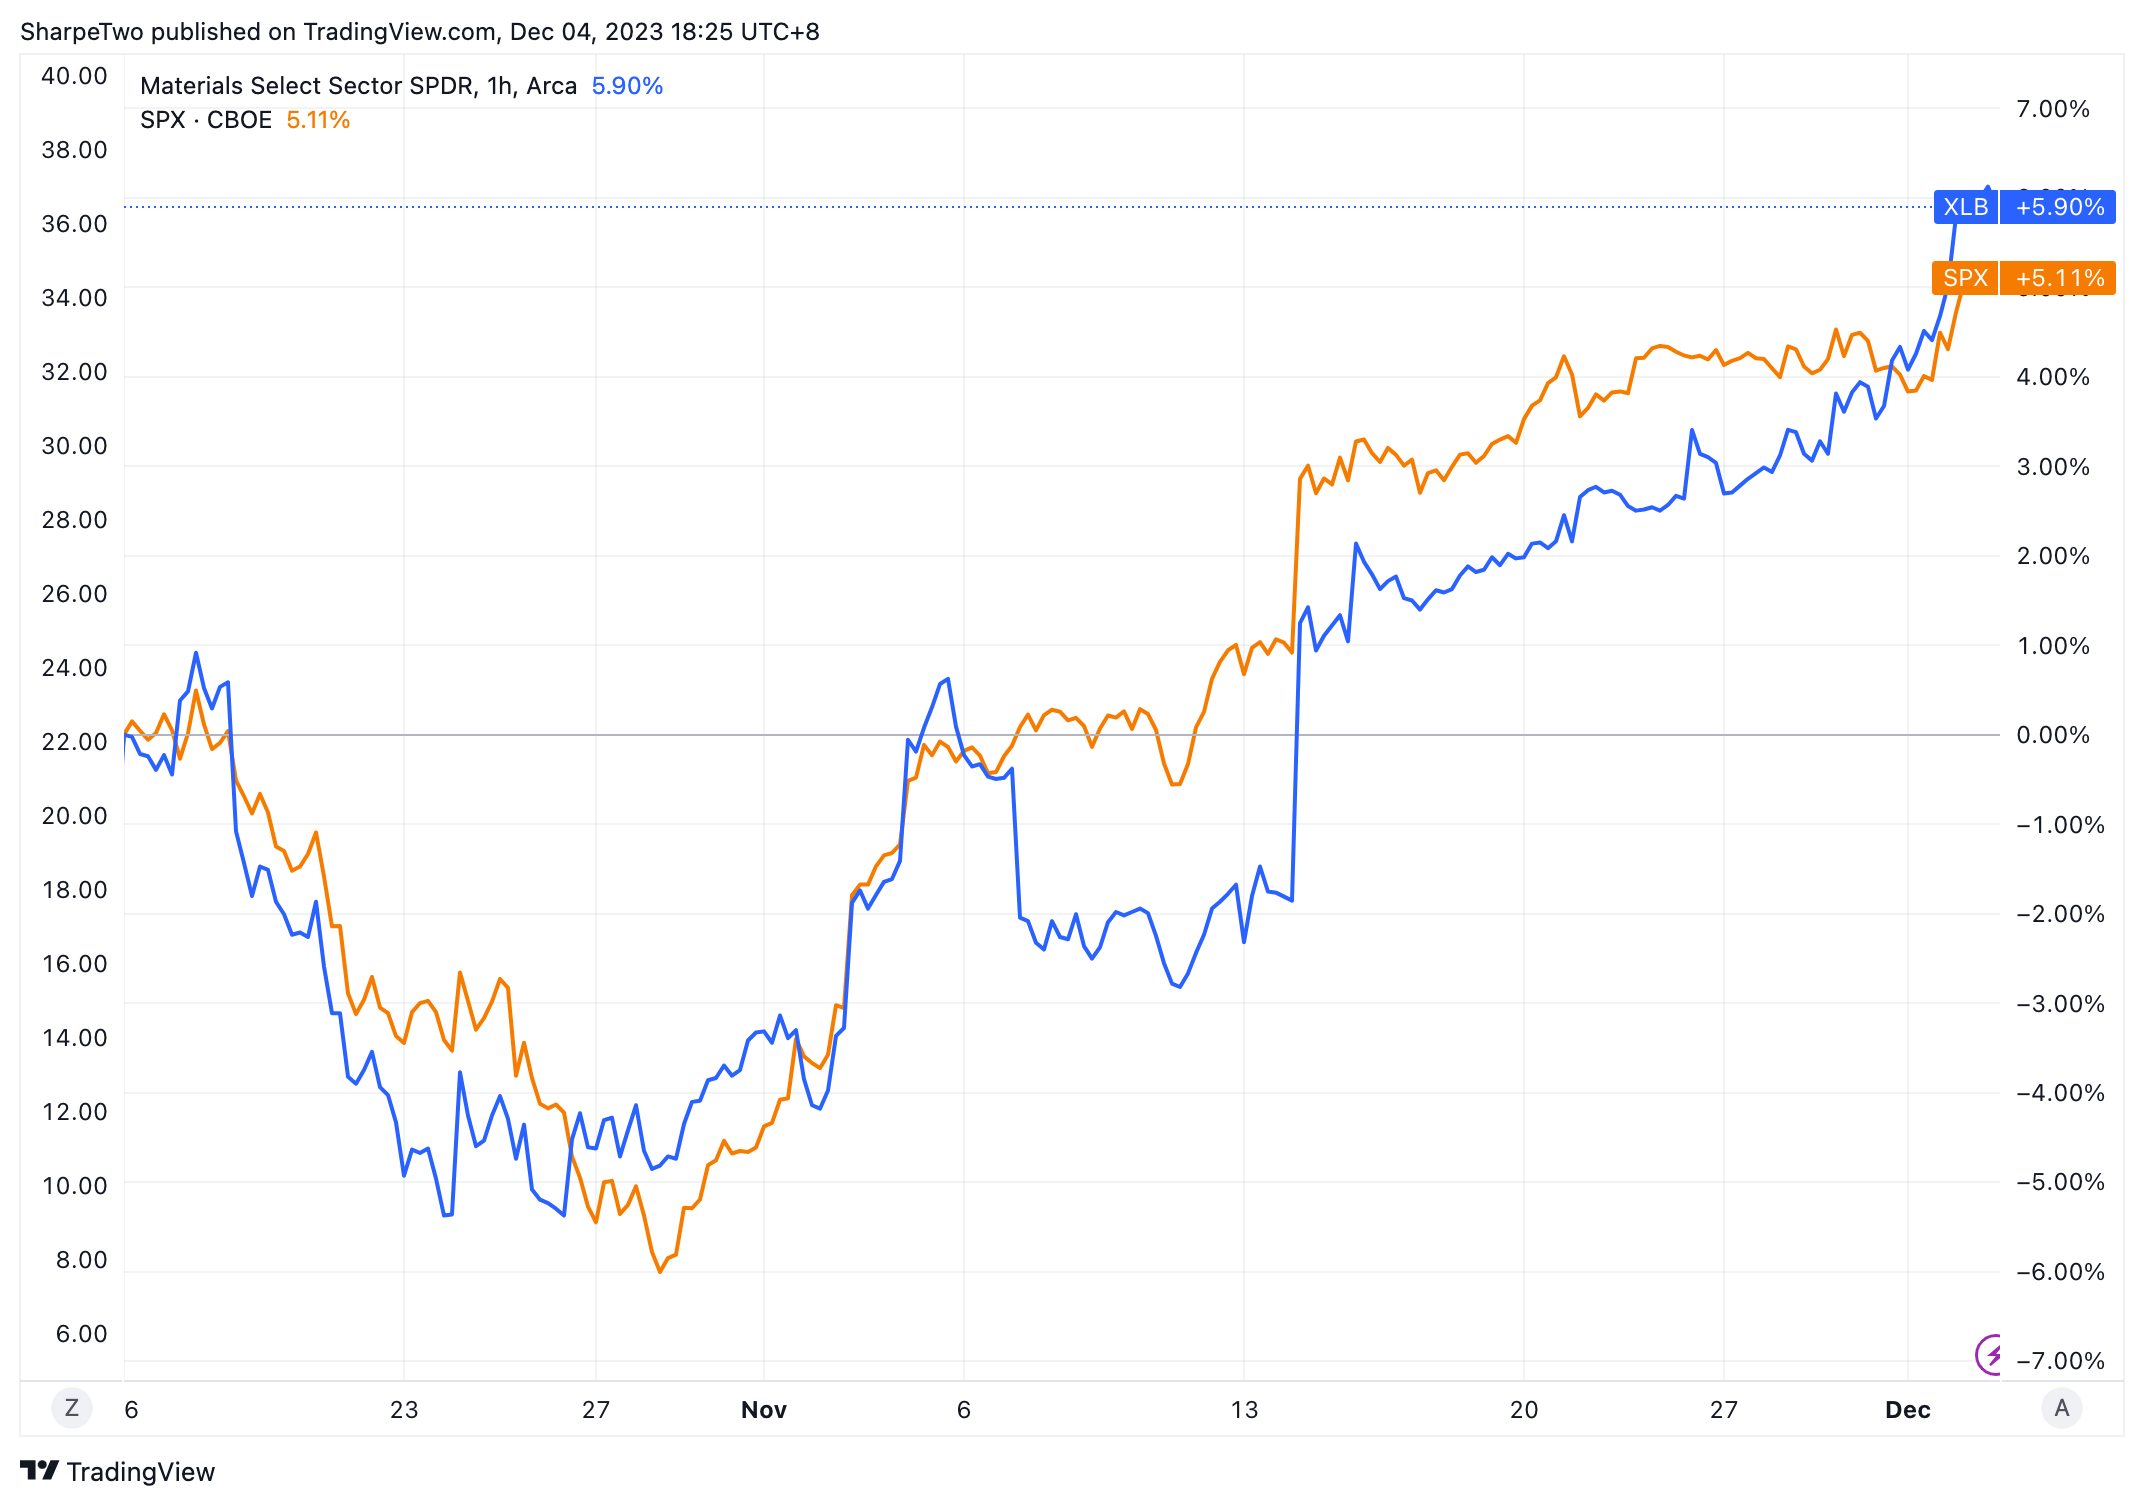
Let's zoom in on a traditionally defensive sector in the S&P 500: $XLB. This ETF grants investors exposure to the materials sector, including chemicals like $DOW. It might not be the flashiest ticker out there, but it's worth a look with the market on what seems like an acid trip.
The Context
With a beta well below 1, this sector often catches the eye of investors during tumultuous times.

For every 1% move in the S&P 500 (or SPY), XLB typically responds with a 0.9% change. It's more responsive than XLU, which tracks utilities, but lags behind XLK, the tech sector ETF.
Its sub-1 beta means it tends to shine during rough patches. Remember how it fared during the height of Covid and the onset of the Ukraine war?

Since mid-October, after flirting with yearly lows above $74, XLB has jumped over 12% to close at 83.35, slightly outperforming the S&P 500.
After a rough month of August and September, this unusual surge for a typically subdued sector has nudged its realized volatility close to a quarterly high in the last week of November.

Now, let's dive into the data and see how the options market has reacted to this flurry of activity.
The Signal and Trade Methodology
The VIX is invaluable for gauging implied volatility in S&P 500 options. But since it's not available for all products, we've recalculated a VIX-like index for XLB using the same methodology.
