
Signal Du Jour - short vol in XLC
How to trade volatility in a heavily-concentrated ETF?
The upside of a low-volatility regime? Most short trades tend to work out. The downside? It's getting harder and harder to find solid signals that volatility is overpriced.
But that doesn't mean we should jump at any opportunity that comes our way. We're sticking to our guns and focusing on a proven method where the odds of making money are in our favor—the variance risk premium, a bit of contango in the volatility term structure, and, of course, an overall regime where the market perceives risk as low or moderate.
Today, we're setting our sights on a trade in XLC, the ETF that tracks the performance of the communication sector.
Let's take a look.
The context
XLC is an ETF heavily concentrated in some of the most popular names on the trading floor. The top 10 holdings make up more than 80% of the fund, with the two biggest positions, META and Alphabet, accounting for over 50% of its structure.

With two of the Mag 7 driving the majority of the fund's performance, it's no surprise that holding this ticker has been a solid play for the past few years.

Since hitting a low of $45.06 in October 2022, the fund has nearly doubled in the last 18 months, and the realized volatility has been crushed to some of its lowest levels.
Sure, there were some bouts of nervousness in 2023, which were closely tied to the uncertainty surrounding the Fed's game plan. But now, with the historical volatility at 15, we're looking at a period of calm rarely seen in the ETF's history.
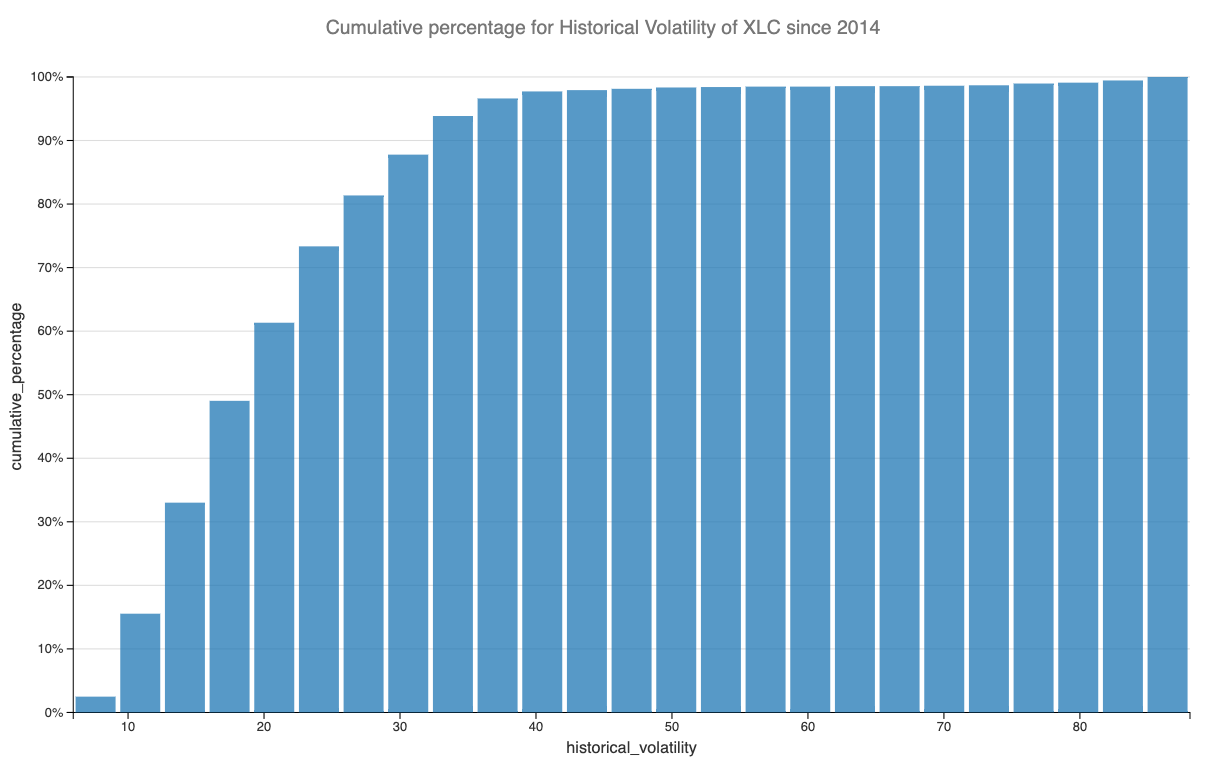
We're in the bottom third of readings seen over the past decade. Sure, that might seem low, but it also means there's room to go even lower, especially if the macro environment stays on an even keel. The Fed has clarified that rates have topped out and is planning three cuts in 2023.
As volatility traders, we're really interested in how much the implied volatility is overstating the realized volatility. This is often a direct measure of success for short volatility positions.
Let's dive into the data.
The data and the trade methodology
First, we'll reconstruct the VIX index using the CBOE methodology for XLC, using option prices 30 days out.
