Signal du Jour - short vol in US equities
"But volatility is already so low?!"
Yesterday's session saw the equity market slowly grinding closer to all-time highs while realized volatility descended to a more normal level observed in 2024. The VIX is still firmly anchored below 14, and the prospect of shorting volatility here would make many practitioners quite uncomfortable.
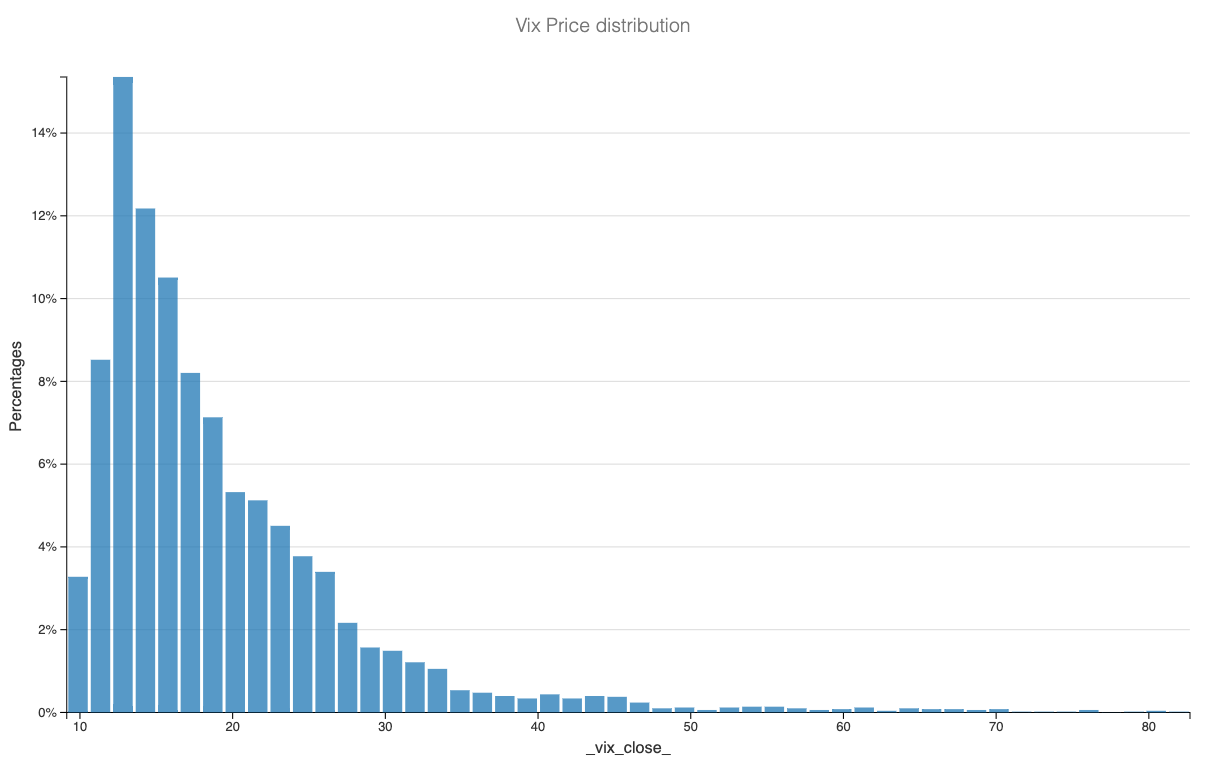
We get it - selling something that looks cheap and is notoriously known for its spikes to the upside is no easy feat. Yet, as we've repeated multiple times throughout Q1, a low volatility level doesn't imply a return to the mean anytime soon. If anything, it's good to remember the natural distribution of VIX prices over a long period.
We have been in the most observed percentiles for twenty years. There is nothing abnormal under the sun, all the more reason to operate business as usual.
Let's get into it.
The context
The month of April was challenging for the equity market. Tensions in the Middle East and the readjustment of monetary policy for 2024 triggered a 7-8% discount from all-time highs. It's a little early to say if this was the opportunity of the year to park your money in stocks. One thing is for certain: This distortion in price didn't last long, and most of the down move is already behind us.
It is also too early to say that realized volatility has peaked and will return to its normal level of 15, observed over the past 12 months.
Yet, yesterday's intraday realized volatility was already on the way down, and considering how quiet the calendar will be for the next few weeks, this idea doesn't seem too far-fetched.
Now, let's look at a reconstitution of the VIX index for QQQ to understand the risk perception in the index over the next few weeks.
As expected, it is on the lower side, and at 17.8, the trade doesn't seem very obvious. However, the VIX has this particularity because it looks at all the ATM option prices and incorporates an element of skew and flatness along the curve.
Let's directly work with option data to identify the best opportunities for option sellers.
The data and the trade methodology
To start, we will compare the price of 35 DTE options in QQQ versus an average of the prices over a 35-day period observed in the underlying.
This more practical measure of the VRP avoids two problems:
First, we know that the latest returns heavily skew the 20% observed in realized volatility but don't necessarily reflect what was normally observed over the past year or so in the index.
We are interested in the ATM straddle price as we will sell it. Therefore, it is very important to compare it to the "recent" risk (an average of movement in the underlying) observed recently.


