Signal du jour - short vol in UNG
Staying clear of US equities for now.
The S&P 500 has surged about 8% since its early August lows, just two weeks ago, while the Nasdaq has technically entered a bull market with an impressive 11% gain. And for those keeping score, NVDA has soared approximately 30% in less than ten sessions—astounding, to say the least.
Couple that with the fastest volatility crush we've seen in recent memory, and suddenly, options prices don't look as cheap as they once did compared to the most recently realized volatility. As we mentioned on Sunday, with Jackson Hole around the corner and NVDA earnings next week, we’re not betting on realized volatility returning to the year’s lowest levels just yet. If you’re selling variance risk premium (VRP), you might want to tread carefully here—prices have drifted upwards much more than straddle prices anticipated, and should we take another sharp downturn, the compensation for your risk might not justify the exposure.
Of course, nothing is ever certain with the market—perhaps we're crying wolf for no reason, and Jackson Hole and NVDA will pass without a ripple. But … it's wise to stay vigilant.
We're steering clear of traditional equities today and eyeing a trade-in UNG, the ETF that offers investors exposure to natural gas.
Let’s dive in.
The context
While the equity markets have been racing at a brisk summer pace, UNG has seen its own share of turbulence throughout the year. It wasn't too long ago, back in June, to be precise, that UNG was hovering around its yearly highs at approximately $21. Fast-forward to now, and it's trading a solid 33% lower—though still a bit higher than just a few weeks ago when it was flirting dangerously with the $13 mark.
It’s important to remember that UNG doesn’t perfectly mirror the price of natural gas. As an ETF designed to track the daily price changes in futures contracts for gas delivered at the Henry Hub in Louisiana, it often declines due to the natural contango in the asset.
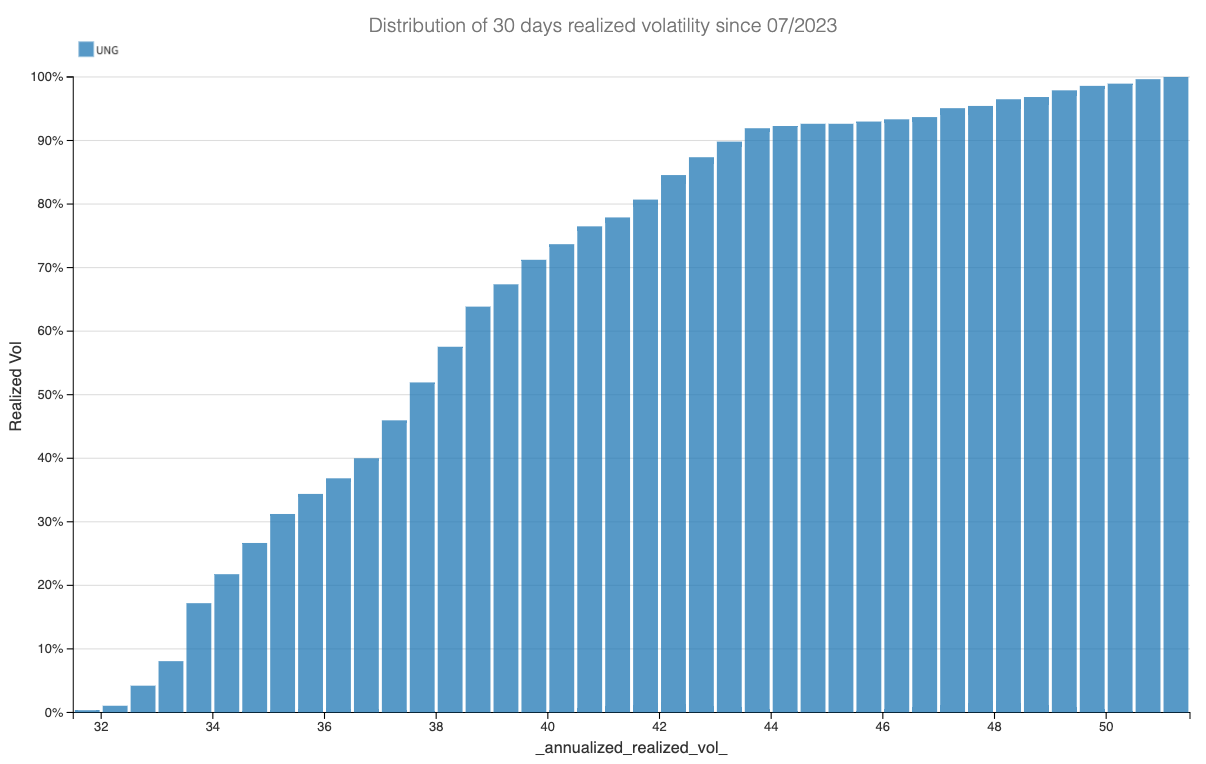
Nonetheless, there’s no denying that realized volatility in UNG has been significantly elevated this year.
Currently sitting just below 40, the realized volatility isn’t as high as the levels we saw at the onset of the war in Ukraine, but it's not far off from the highest levels observed this year. What's particularly noteworthy is the uptick in volatility throughout Q3, which now places it in the 70th percentile of observations over the past year.
Given these factors, options prices are likely reflecting the current level of risk in the underlying asset, favoring those providing insurance in UNG.
Let’s dive into the data.
The data and the trade methodology
Let’s begin by comparing the 30-day realized volatility in UNG with the implied volatility in options prices. For this, we use the bid from the quotes in out-of-the-money options in UNG to reconstruct a variance swap.


