Signal du Jour - short vol in TMF
A bond trade, now that the Fed is behind us.
We finally have it—the first rate cut of the year. And what a cut—50 bps! It came as a bit of a surprise, with the market expecting 25 bps. Journalists at the press conference were eager to understand what had shifted in the Fed's perspective to suddenly justify such a move.
Initially, the market reaction was extremely positive, but things reversed during the press conference. However, this brief bout of volatility is nothing compared to what we've seen over the past two months, and realized volatility is clearly on the decline.
Now that the first rate cut is behind us and we have some clarity on the terminal rate for the end of 2024 (expect another 50 bps over the last three FOMC meetings), we'll turn our attention to a trade in the bonds market, specifically in TMF. This leveraged ETF offers 3x exposure to the returns in the long-term bond complex (20 years+).
Let’s dive in.
The context
Remember when, nine months ago, the market was pricing in 6 to 8 rate cuts throughout the year? We were so certain that things would tumble if the Fed didn’t act swiftly. Well, not only was that prediction completely wrong, but so were the expected consequences. The equity market performed relatively well—if you put aside the summer—and after a rocky Q1 where the bond market was adjusting its rate expectations, things gradually improved in Q2 and Q3.
TLT is up 2.5% this year and bounced back from -8% in April, all while delivering a 4% annual yield—not bad at all.
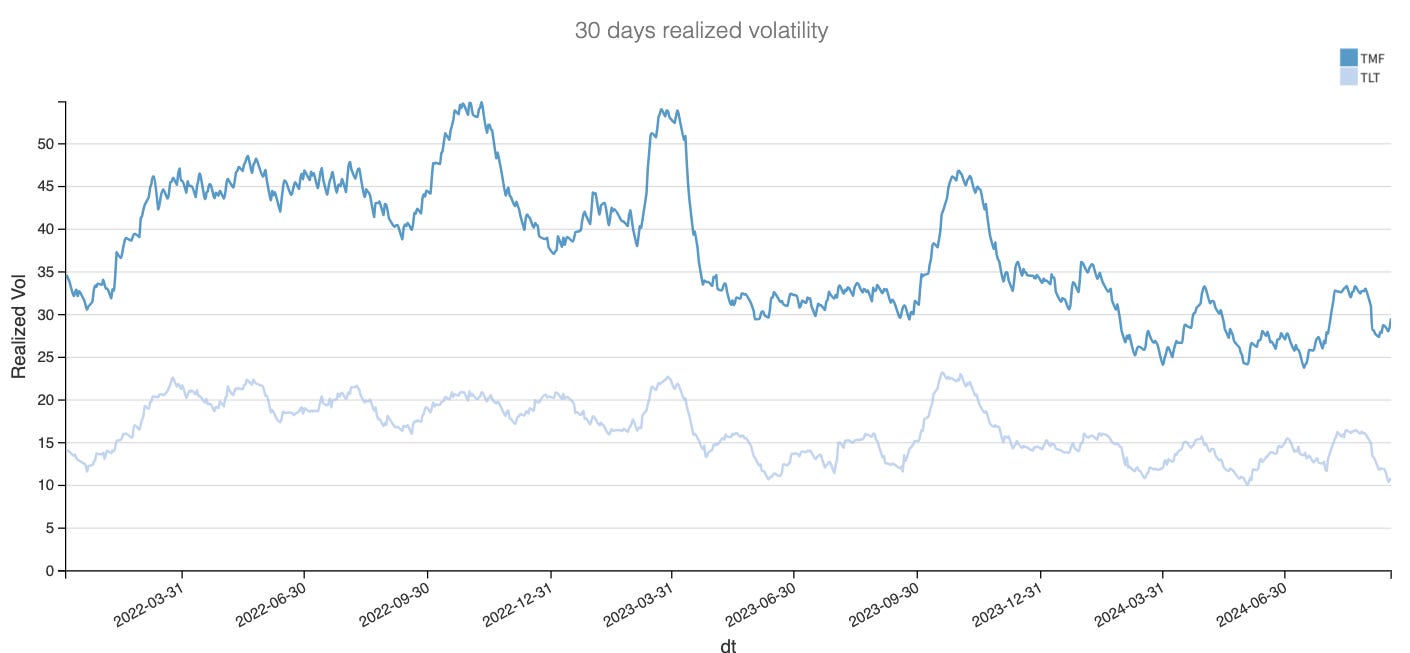
As one might expect, the swings in TMF have been particularly pronounced, given that it replicates the performance of a portfolio of long-dated bonds by a factor of 3. Yet, the realized volatility this year has been fairly contained in both the ETF and the underlying bonds.
Even though things moved a bit over the summer, it was nothing compared to the tsunami of selling orders in the bond complex during the summer of 2023 (Who remembers that tweet from Bill Ackman? Then again, he tweets so much that we forgive you if you don’t). In fact, 2024 has been a relatively quiet year for both products. With the first rate cut behind us and clear visibility on the rate trajectory between now and the end of the year, it’s unlikely we’ll see realized volatility creeping up.
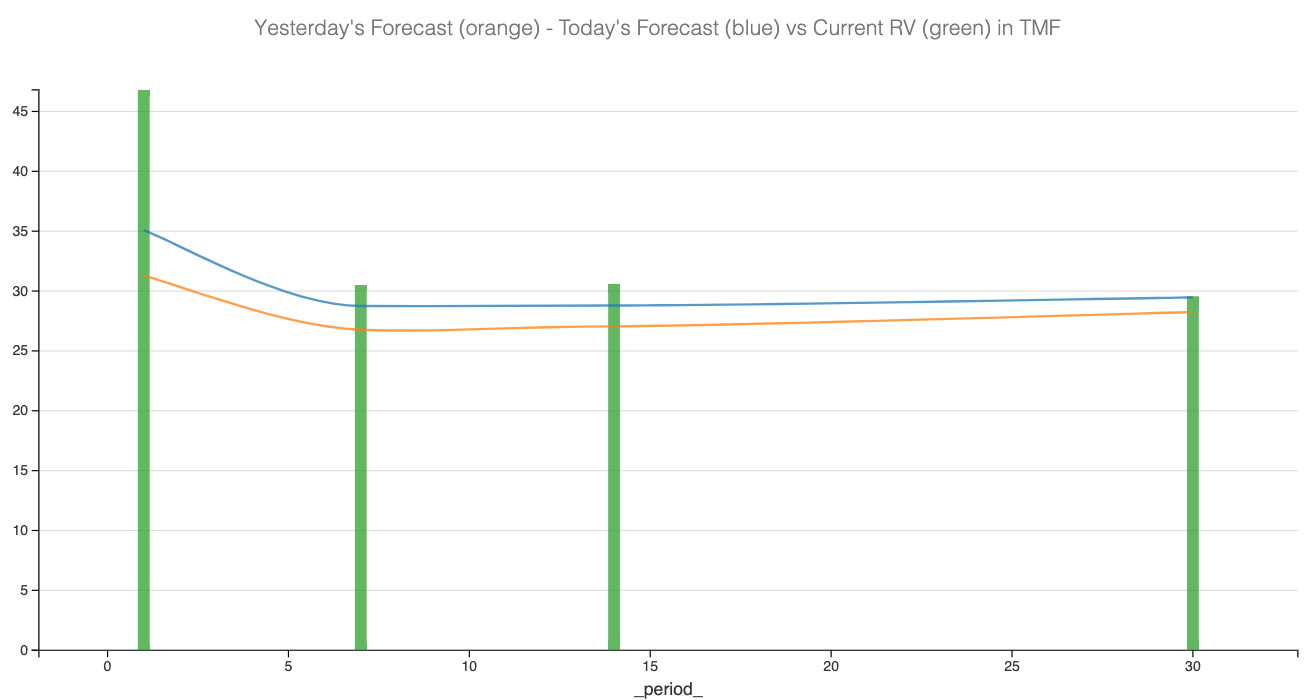
Our forecasts for the next two weeks are very much in line with our observations over the past two weeks: somewhere between 28% and 30%.
Now that we have some context let’s compare this to the dynamics in the options market and get a view of the implied volatility.
The data and the trade methodology
Let’s examine how implied volatility usually compares to realized volatility in TMF. The difference between the two constitutes the variance risk premium (VRP), an essential measure for volatility sellers.


