To Steve—who’s been with us since the beginning and got us into MSOS.
Elon Musk: left, right, and center—though mostly leaning right these days, especially as the presidential race heats up. The outspoken CEO announced he’d donate $1 million per day to a random person in Pennsylvania, as long as they signed the PAC. How’s that for political influence?
But back to our favorite topic: financial markets. Yesterday, Tesla’s earnings hit the streets. They missed expectations, yet the stock jumped 12% on the promise that 2025 would be a stellar year, thanks to cost-cutting measures and the all-in bet on automation and robotics. How’s that for soothing worried investors?
Long gone are the days when Musk got into hot water for smoking a joint live on Joe Rogan’s podcast. Back then, marijuana was barely legal and not exactly Wall Street-approved. What’s the point here?
Okay, I get it—this train of thought might seem a bit hazy, like the author’s a little... high. That’s because today, we’re shorting volatility on MSOS, the ETF giving exposure to—you guessed it—the cannabis sector. Feeling like a grassroots dealer already? Wait until you see the margin on the product straddle.
Since 2023, the ETF has been trading within a tight range, oscillating between the low and the very low—somewhere between $5 and $9. While the price levels might seem small, the movement within this range is quite significant. This will become more important when we dive into options pricing.
From a realized volatility standpoint, MSOS isn’t exactly tame.
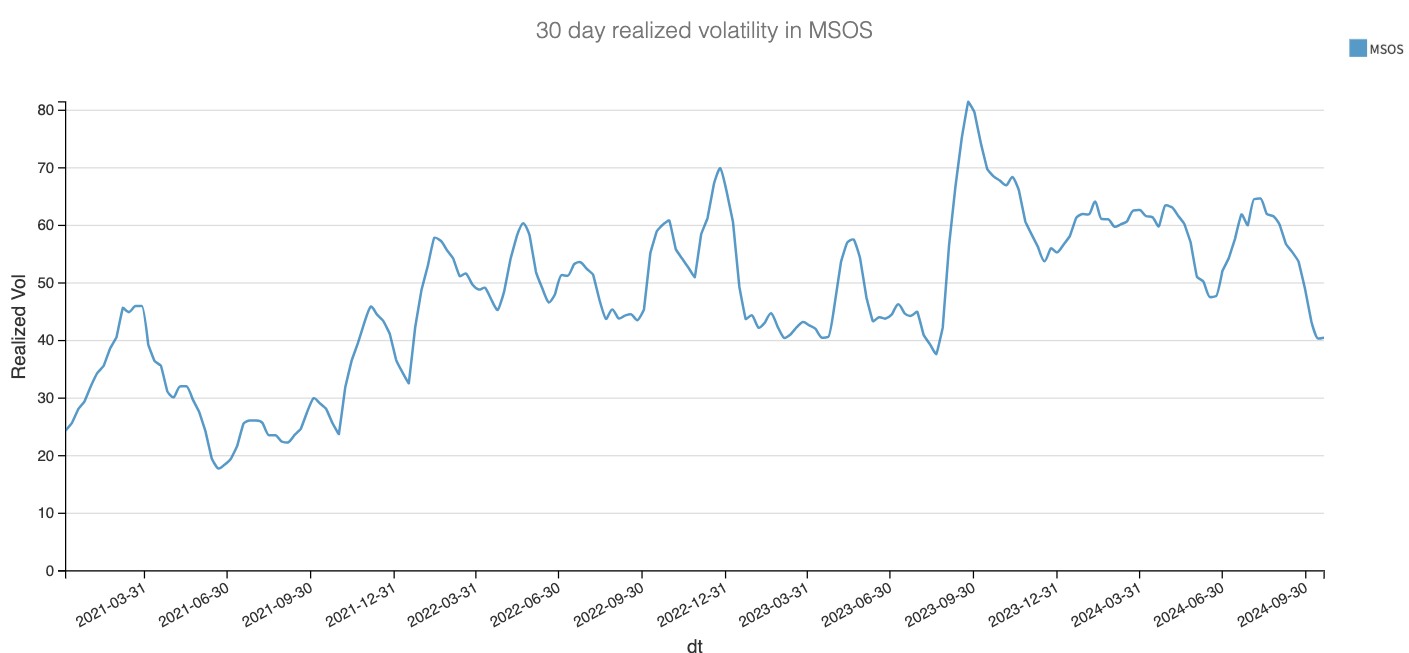
Currently sitting around the 40% mark, which is roughly mid-range since its inception, volatility peaked above 60% over the summer during a market downturn. It even hit almost 80% a year ago when uncertainty about the rate trajectory was shaking the market.
So, despite the low price levels, there’s notable activity and movement. And with the US elections around the corner, we anticipate a bit more volatility than what we’ve seen over the past 15 days.
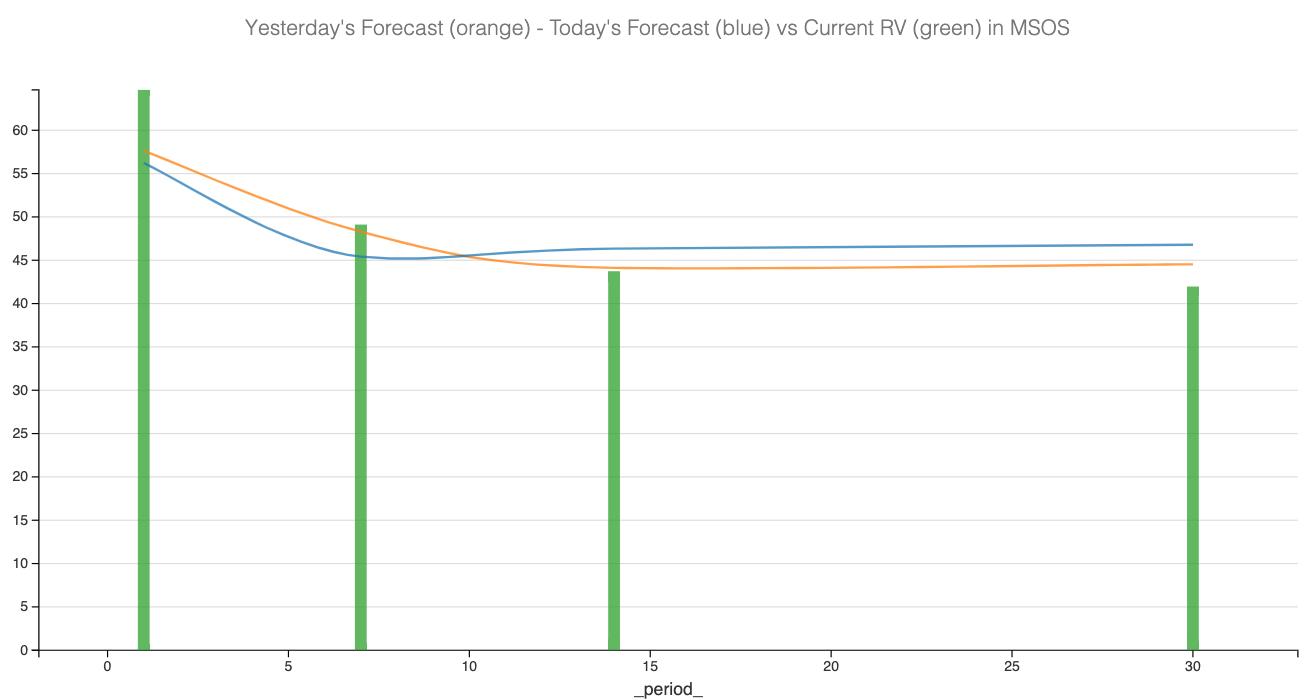
With that context in mind, let’s dive into the options data to explore how we could structure a trade in this product.
The data and the trade methodology
Let’s start by comparing the realized and implied volatility using options expiring in 30 days to get a feel for the variance risk premium (VRP)—a crucial metric for designing a trade in the options market: