Signal du jour - short vol in INDA
One trade a month is all you need.
We will receive new PPI data in a few hours, and Jay Powell, the Fed chairman, will speak at the Annual General Meeting of the Foreign Bankers Association in Amsterdam. Unless there is an extreme surprise on both fronts, the market is not expecting anything major, and everything points to another lazy Tuesday—unless you are trading GME (we don’t, not yet).
Therefore, we will consider a trade in a different geography. This morning, we look into INDA, the ETF tracking the performance of the Indian stock exchange. India is well known as a major economic powerhouse worldwide. What is a little less known is its buoyant options market. INDA doesn’t present the same characteristics, but options data for a decent opportunity on the short side of volatility is worth investigating.
Let’s get to it.
The context
INDA has had an amazing bull run, adding almost 33% over the last 12 months. In that sense, its performance is quite correlated with the major US indices, even though it has its own characteristics.
If you are looking for a pair trading idea, this one seems to present some solid characteristics. However, we haven’t tested it rigorously, so you may want to spend more time figuring out the details before jumping in.
As usual, we will look into things more from a volatility perspective. We were surprised to see the realized volatility in INDA at 10!
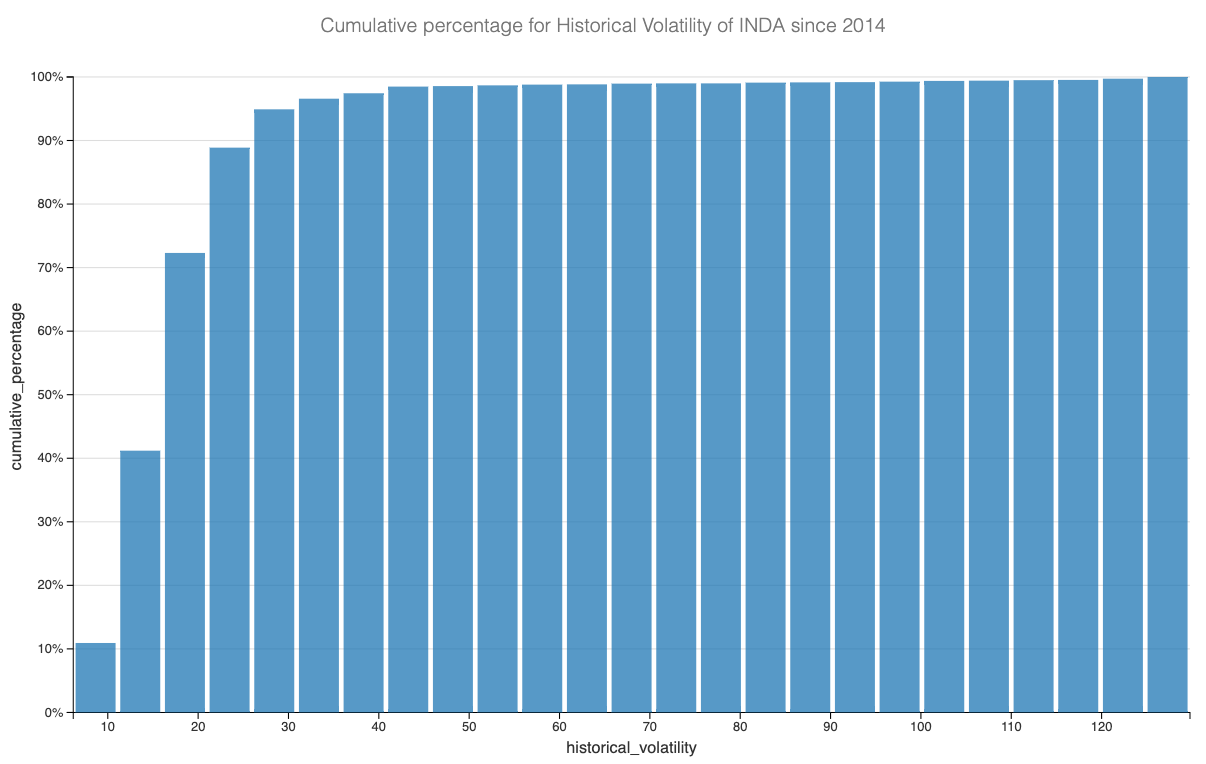
What was even more surprising was that over the past two years, except for a huge surge at the beginning of the Ukraine war, the volatility in the index is fairly contained and doesn’t go much above 20. It's not exactly what you would expect from a major worldwide player, but it's still volatile and susceptible to external shocks. We thought this distribution was recent and different from what was observed in 2014. Once again, we were very wrong.
INDA spends 70% of its time below 21. Now, INDA does not perfectly reflect the performance of the Nifty 50—over the past three years, the difference in performance has been staggering.
It is possible that the volatility in the ETF does not necessarily reflect what is observed directly in the Nifty 50. Therefore, we insist that this analysis should be read primarily on the ETF and not the broader Indian equities, which are accessible only to Indian nationals anyway.
Let’s now look into the options data.
The data and the trade methodology
With such a low level of realized volatility, we would expect to see the price of options adjust. Let’s start by looking at a reconstruction of the VIX index using options prices in INDA. (We insist on this point; this number cannot be interpreted as a reading for the VIX in the Nifty 50, as demonstrated above; the products are quite different.)


