Signal du Jour - short vol in EWT
Blue sky now that the Trump's comments have been digested?
The US equities market calmed down yesterday after an eventful week, with the VIX back below 15. Is it on the path back to 12? As we mentioned on Sunday, this is not our favorite scenario, especially with major earnings, inflation numbers, and a FOMC meeting for next week.
Since the US calendar is very busy, today we’ll explore something different: we’re heading to East Asia to look into a trade-in EWT, the ETF offering exposure to Taiwanese equities.
Isn’t it risky with a potential Chinese invasion and Microchips being a source of tension between China and the US? It is indeed risky. Let’s see if we can get compensated enough for being the bearer of last resort.
The context
Taiwanese equities have had a strong year in 2024, up more than 17%. If it weren’t for a rough patch over the past two weeks, they would outperform the S&P 500 and Chinese equities (FXI in the chart below) by a significant margin.
What exactly happened over the past two weeks? A combination of factors. Firstly, some comments from Donald Trump suggesting Taiwan should pay the US for its defense took a toll on investor morale. As if that wasn’t enough, Trump then suggested that Taiwan was stealing business from the US in the microchip sector. Considering the sheer size of TSM in EWT, it's no wonder the correction happened.
Is it justified? That’s not really for us to say.
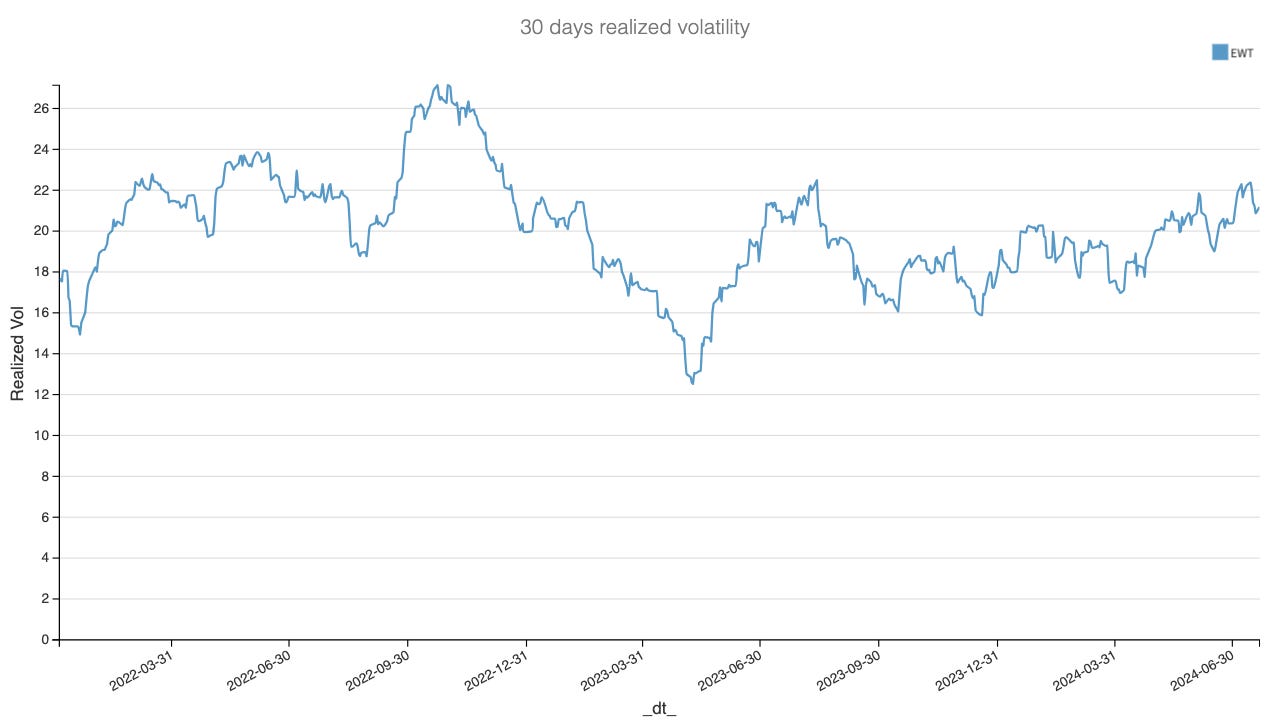
But with such a significant downturn, we would expect volatility to skyrocket. The 30-day realized volatility did go up, but not to the extent one would expect.
It's not exactly alarming that it went from below 20 at the end of June to a spike of 22 mid-last week. Let’s take a look at the realized volatility term structure.
Over the last 13 days, we have realized 25% in volatility. What's striking is that since then, things have quieted down again: over the past seven days, we realized below 20%. Overall, we are pretty close to the long-term average of 21% for this product.
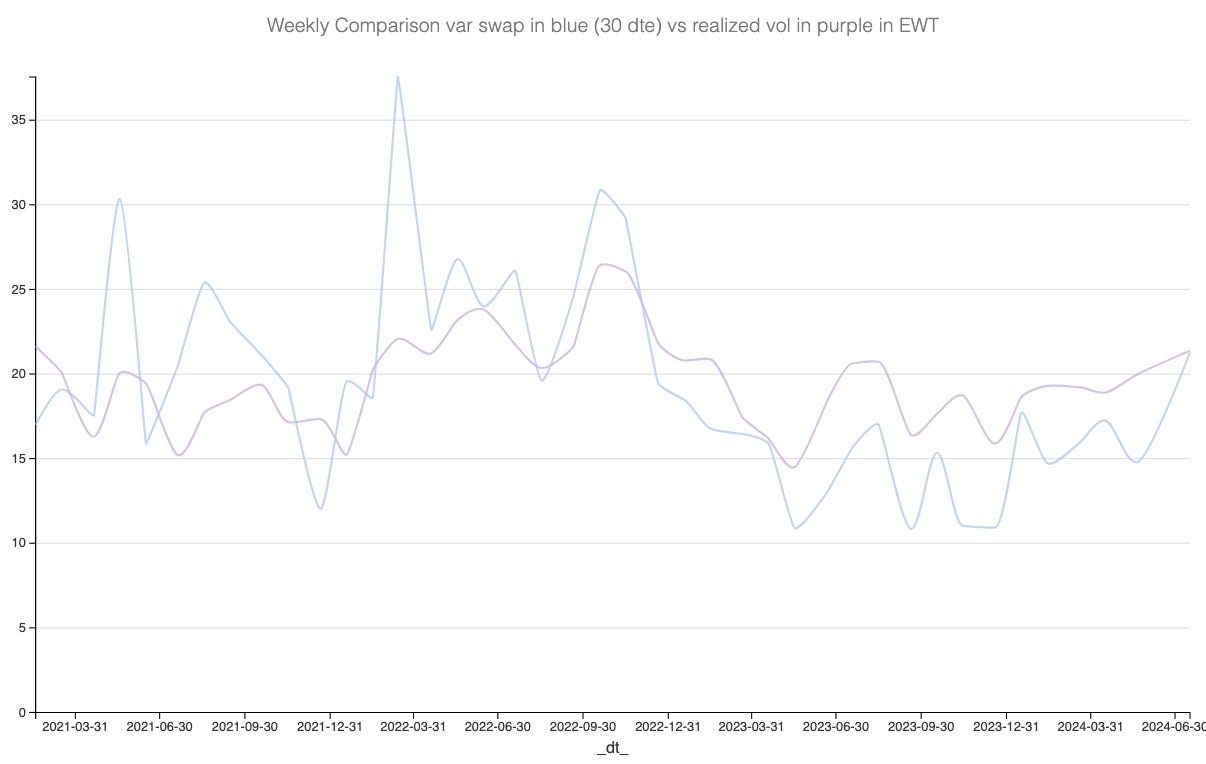
So, what is evident at this stage is that the product has been under some stress lately, but it remains contained and manageable. Let’s see how the options prices react and whether they may be overstating the recent movements observed in EWT.
The data and the trade methodology
Let’s start by examining the implied volatility in EWT over the past few weeks and comparing it with the realized volatility. We used direct options prices—replicating a variance swap calculation—rather than the Black-Scholes equation.


