
Signal Du Jour - Long/Short volatility in the tech space
What does QQQ see when looking in the rear view mirror?
This week is set to be a big one in terms of earnings, with heavyweights like MSFT, AAPL, and AMZN on the roster. Their announcements have the potential to significantly sway the market – just recall the recent impact of TSLA and INTC. Or, conversely, it could all turn out to be much ado about nothing. Who can say for sure?
At Sharpe Two, we don't claim to have a crystal ball, and we steer clear of speculating on market reactions to these events. Our focus? Sifting through the volatility space and scouting its mean-reverting nature to identify more predictable setups.
Now, trading volatility ahead of major earnings announcements can be a risky game. Once again, who can know for sure how the market will react?
But what about a strategy where we can be both long and short on volatility? That’s a scenario we find more palatable.
Today's spotlight is on XLK and QQQ, two ETFs that offer exposure to the tech sector, each with its unique characteristics.
Let’s have a look.
The context
QQQ, often referred to as 'the Qs,' is a household name in the ETF world. It tracks the Nasdaq 100 and stands as one of the most liquid ETFs globally.
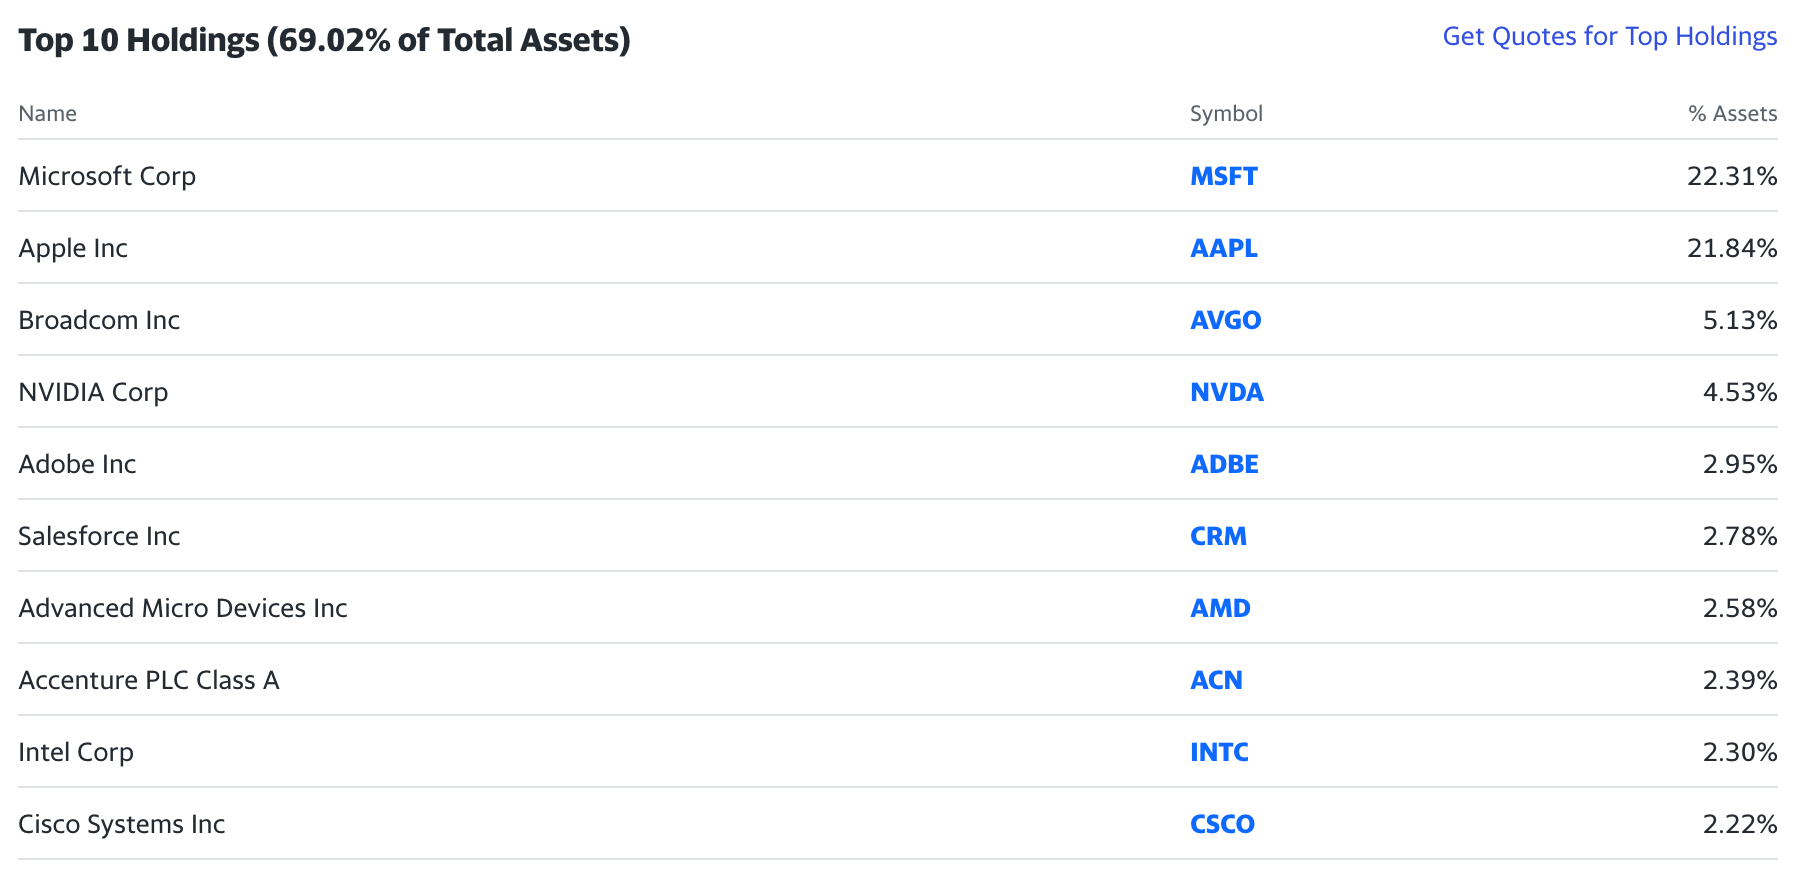
XLK, on the other hand, zeroes in on the technology sector. With only 66 holdings, it might seem more focused, but it's worth noting the heavyweights within. Notably, giants like MSFT and AAPL together make up a whopping 43% of the fund!
Despite the absence of big names like AMZN, META, GOOGL, and TSLA, XLK's performance closely mirrors that of QQQ.

Sure, there's a divergence growing between the two over time, but it appears fairly predictable, offering ripe opportunities for pair trading. This similarity isn't surprising, given the overlapping nature of their underlying assets.
But does this correlation extend to their realized volatility as well?

Indeed, the one-month realized volatilities of QQQ and XLK show a strong correlation. This isn't surprising, given that realized volatility typically measures the standard deviation of returns over a specific period.
But what about their implied volatility, which looks ahead and reflects market expectations about future movements?
To explore this, we've reconstructed a VIX-like indicator for both QQQ and XLK.

While their relationship remains robust, we can observe notable divergences at times. This variance presents interesting opportunities for long/short volatility traders. Our premise is straightforward: as these two products are similar enough, any pronounced divergence in their implied volatility is likely to revert to the mean eventually.
Now, let's dive into the options data to ascertain the most effective way to execute this trade.
The data
One of the benefits of a VIX-like index is its ability to quickly summarize the volatility of an asset. However, for retail traders, such an index isn't easily tradable. That's why, at Sharpe Two, we focus more on analyzing straddle prices directly rather than solely relying on implied volatility figures. Ultimately, the most direct measure of implied volatility is found in the at-the-money straddle price.
Now, let's examine the ratio of ATM straddle prices for QQQ and XLK.
