
Signal du Jour - long/short the banks
What diverged must converge back (in theory).
There we are—Trump has finally unveiled his big plan to “liberate” the U.S. economy from the tentacles of globalization (sic), which, if we believe him, is the reason America isn’t great anymore. But give it six months, and thanks to this “beautiful bill,” America will rise again.
We have our doubts. So does the market. After an all-day rally and a bump at the start of his Rose Garden speech, prices abruptly reversed as the President dropped some pretty astonishing numbers—numbers more likely to slow the global economy and juice inflation than solve anything. But once again, we’re neither economists nor politicians. We’ll stick to what we know: volatility and data.
Especially because periods like this—where everything’s up in the air—tend to throw off interesting signals. Today, we’re eyeing a long/short setup in the banking space.
Let’s have a look.
The context
As it sinks in that the economy may be slowing—and potentially heading for a downturn—the market has been turning up the heat on the financial sector, slowly but steadily.
It’s not unusual to see regional banks—smaller, less capitalized—take it on the chin a bit more than their larger counterparts in these moments. Still, what started as a strong year following President Trump’s election is morphing into something trickier, even for the too-big-to-fails.

XLF is still up 4% year-to-date, but it dipped briefly into the red over the past month, and today’s open will be worth watching. JPM is hanging onto gains, but BAC has had a rougher time, even if it’s managed to claw back some of the steep losses from a few weeks back.
Unsurprisingly, realized volatility in the space has picked up meaningfully.
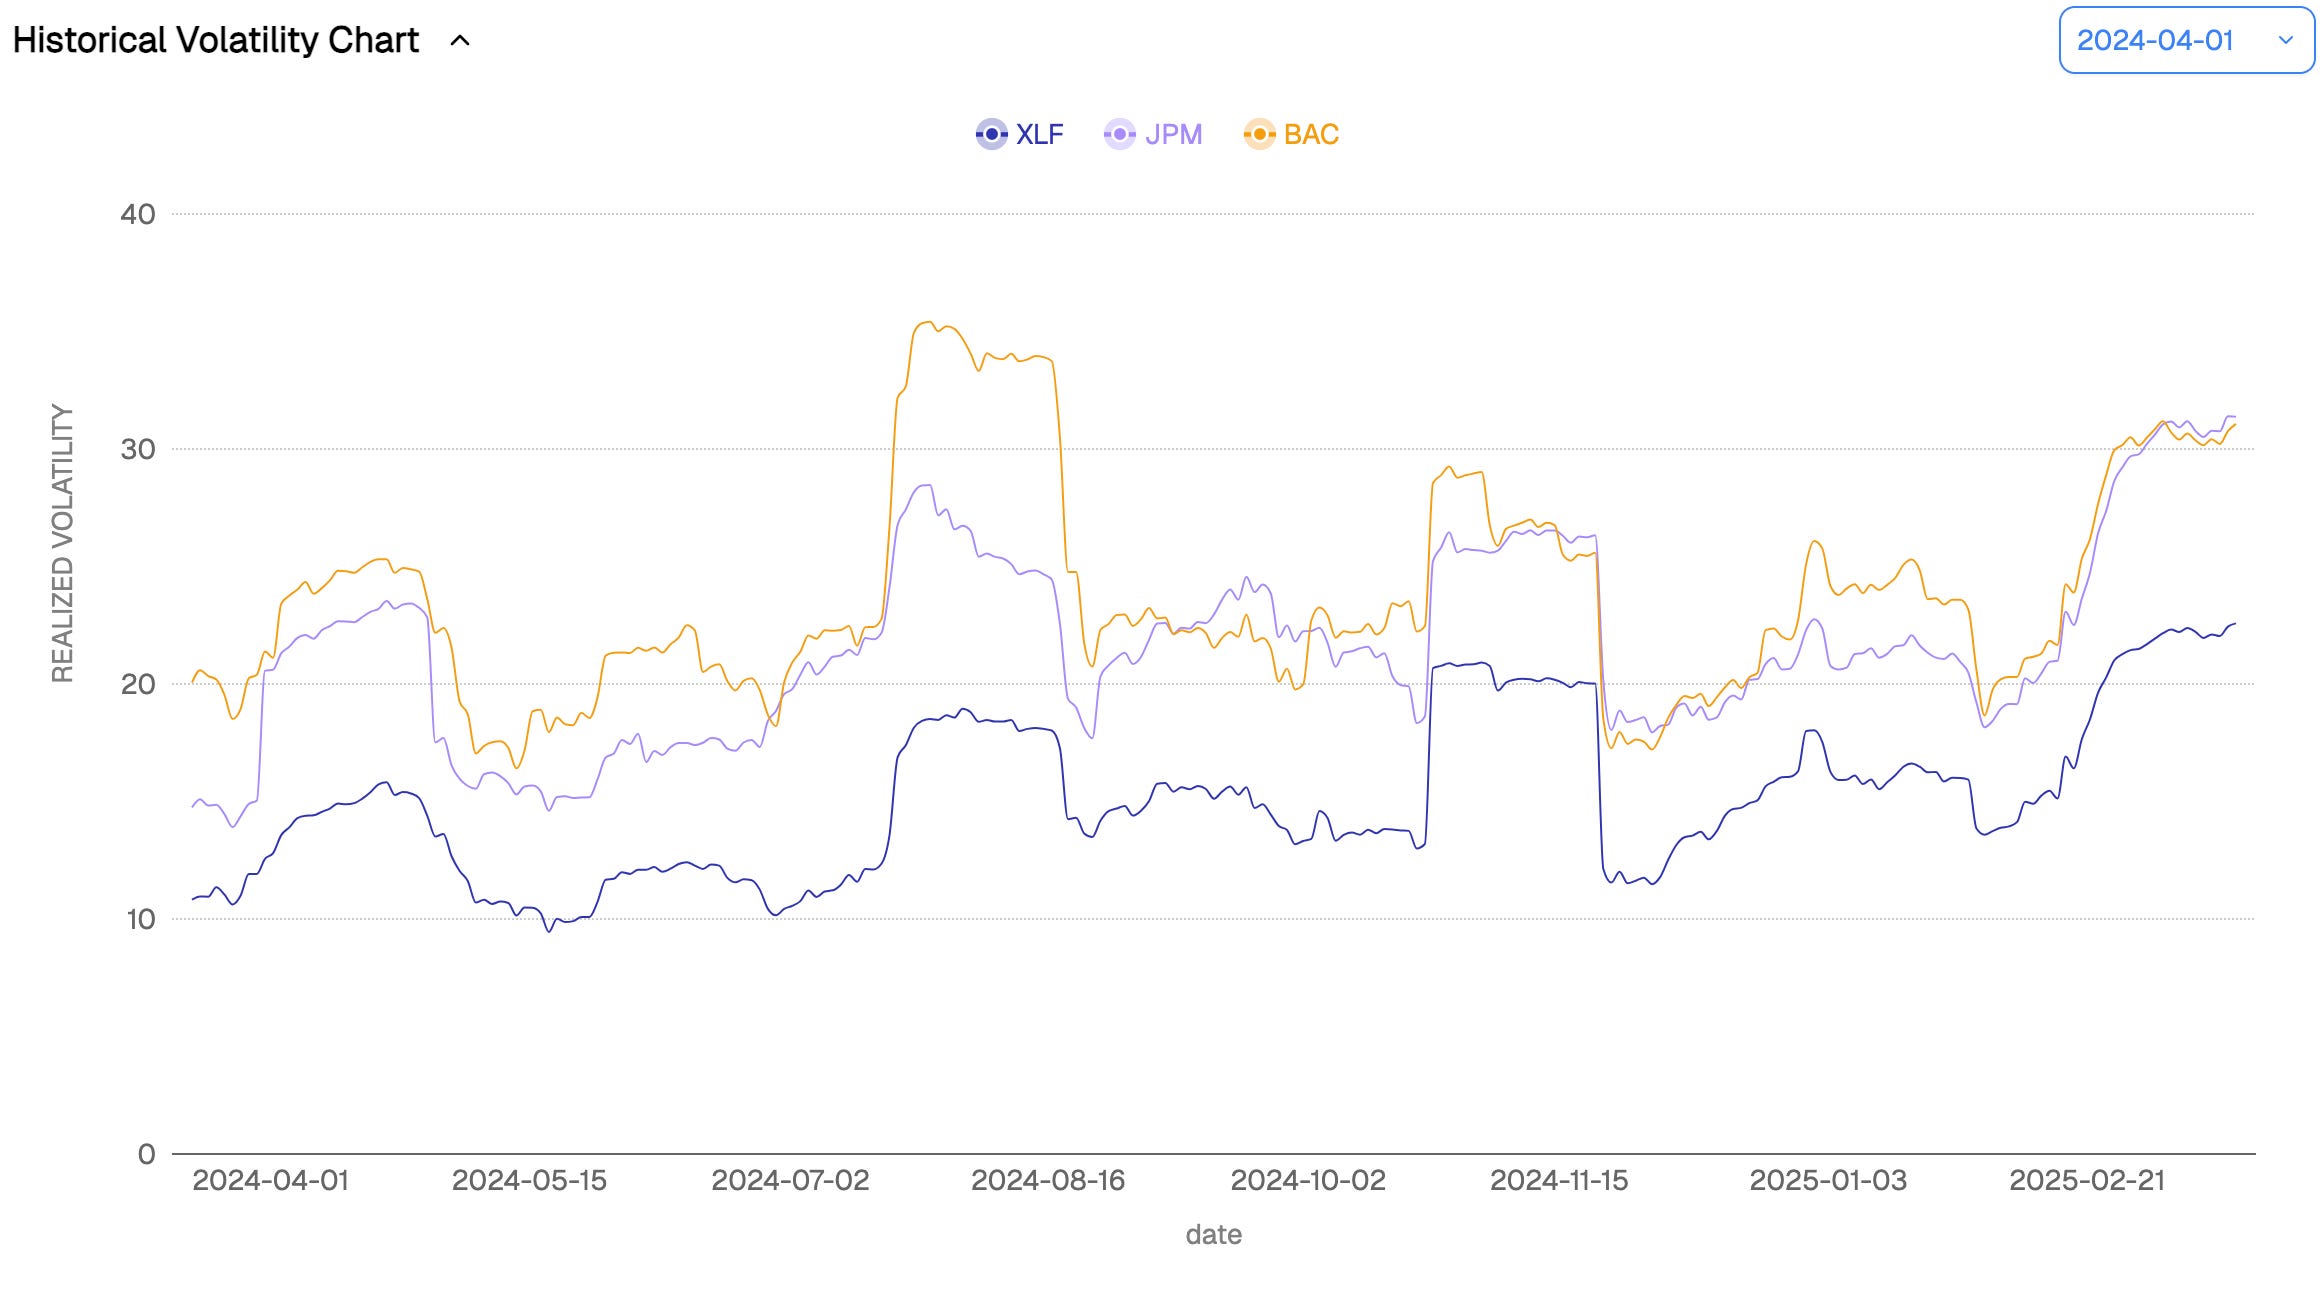
If we take last August as the last true moment of market panic, current 30-day realized volatility is already above those levels for both XLF and JPM. BAC, which had reacted more sharply back then, still has a few percentage points to go.
What’s particularly clear from this chart is how tightly intertwined JPM and BAC’s realized vol has been—especially since the presidential election. That alone doesn’t justify a long/short vol trade, but we’ve at least crossed some important validation checkpoints before going any further.
Now it’s time to turn to implied volatility—the only source of truth when it comes to structuring a long/short setup.
The data and the trade methodology
To compare implied volatility across the two names, we’ll reference their VIX-style measures—calculated using the CBOE methodology—at 30 days.

Once again, it's clear that both implied volatilities move largely in sync. They may diverge here and there, but overall, they’re highly correlated and tend to land in the same neighborhood.
What stands out—without needing any fancy transformation—is that JPM’s implied volatility has dropped much faster than BAC’s. It’s possible that, given recent economic shifts, they may not mean-revert in the same way this time. But to get a better feel for that, let’s look at how their correlation has evolved over time.

While it’s weakened over the years—especially in 2024—it’s snapped back to strong levels since the presidential election. That should give us some confidence that any outsized divergence between the two is likely to mean-revert fairly quickly.
