
Signal Du Jour - IEF Sharpe Ratio 2.55 Win Rate 86%
A cheap lunch isn't a free lunch either
We won't sugarcoat it – scouting for short volatility trades in the current market is tough, with most of our indicators leaning towards long opportunities.
But that doesn't mean we should settle for less-than-ideal metrics. As the old saying goes, 'If you can't beat them, join them.'
At SharpeTwo, we're not exclusively tied to short positions. When we spot promising opportunities on the long side, we're open to exploring them. And with the Fed's announcement looming tomorrow, it's an opportune time to sprinkle some long vega into our portfolio for some diversification.
Today, we look into IEF, an ETF that exposes the 7 to 10-year part of the US treasury curve—quite timely right before the Fed and decision on the rate policy tomorrow.
The Context
We've already set the stage, so let's not dwell too long on the context. The Fed kicked off a battle against inflation in March 2022, rocketing rates from 0% to 5.25%. This aggressive shift didn't come without its share of turmoil – 2023 saw a widespread repricing of bonds, particularly in the second half of the year, leaving many investors nursing significant losses.
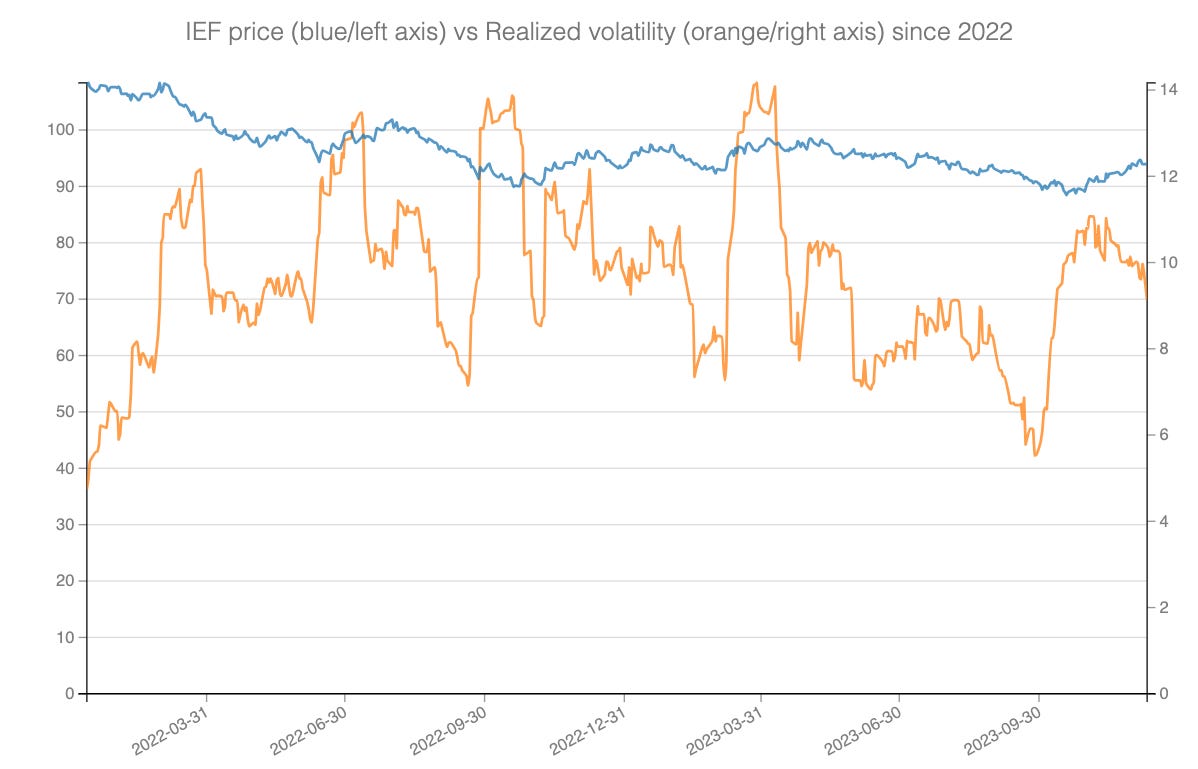
IEF, which represents the mid-term part of the curve, was somewhat less affected than the longer end (TLT in the chart below)

Nevertheless, the volatility we've seen this year, especially at the start of 2022, was striking. This was when the market rapidly adjusted its short to medium-term expectations.
Even though conditions have improved since the last FOMC meeting, the sustained high level of realized volatility reflects the ongoing anxiety among bond traders about future outcomes as we approach year-end.
While there aren't major expectations for change in tomorrow's announcement, the market is still grappling with a crucial question: What will the interest rate trajectory look like throughout 2024? The market might take a few days to fully process this information, potentially opening up opportunities across various parts of the expiration cycle.
Now, let's dive into the data.
Two signals and their methodology
The options market data initially painted a consistent picture across all expiration cycles. Let's take a closer look by comparing the price of At-The-Money (ATM) straddles with the actual realized movement for 18 DTE (Days to Expiry) and 39 DTE and then calculating a z-score for each.

Both scores are well into the negative territory, suggesting that the straddles are priced relatively low. However, our models offer a different perspective on the situation.
As the saying goes, there's no such thing as a free lunch. The market doesn't price anything cheaply without reason. Recall our discussion about being offered a 'cheap Rolex' on the streets of London when we examined HYG a few weeks ago.
How did that scenario play out? Following the market's expectations proved correct, as there were no significant developments. We're observing a similar pattern in the short-term expiration cycle for KRE. Our analysis aligns with the market consensus that the 7/10-year segment of the curve is unlikely to be significantly impacted by the upcoming FOMC announcement. And while implied volatility may seem cheap, the market is likely baking a healthy profit margin in the price of the straddle.
The situation takes a different turn for the longer part of the expiration cycle.
