Signal du Jour - Long/Short in EWY
Adding some hedges before Thursday
With just a few more days before Jay Powell's testimony to Congress, many of our indicators are flashing strong short volatility signals, a sign that the market is getting ready for some potential surprise.
If all of this happens to be a non-event, one has to stay ready to pounce, although we wouldn’t recommend making a move before everything settles down. The situation should be sufficiently clear by Friday afternoon to inform our next moves.
In the lead-up to this, it's prudent to consider scaling back on positions. Incorporating some strategic long volatility positions as a precautionary measure could also prove wise.
However, we're staying on course with our diversification strategy, aiming to sidestep sectors and geographies susceptible to sharp reactions following any unexpected monetary policy announcements.
Today, we consider short volatility in EWY, the ETF tracking the performance of the Korean index.
Let’s have a look.
The context
The year kicked off on a rocky note for Asian equities, with EWY bearing its share of the volatility. The ETF, closely tied to the ebbs and flows of Chinese market performance, saw a nearly 10% drop early in January, teetering on the edge of what many consider the threshold of a bear market.
Since its early year tumble, aided by the buoyant technology sector globally, EWY has recouped most of its initial losses. These dramatic fluctuations over a short span have since given way to more stabilized levels of realized volatility, which recently dipped below 20, ushering in a semblance of calm.
Yet, the truth often lies in the forward-looking lens of implied volatility. This metric sheds light on market anticipations for the coming weeks, offering valuable insights for strategic positioning.
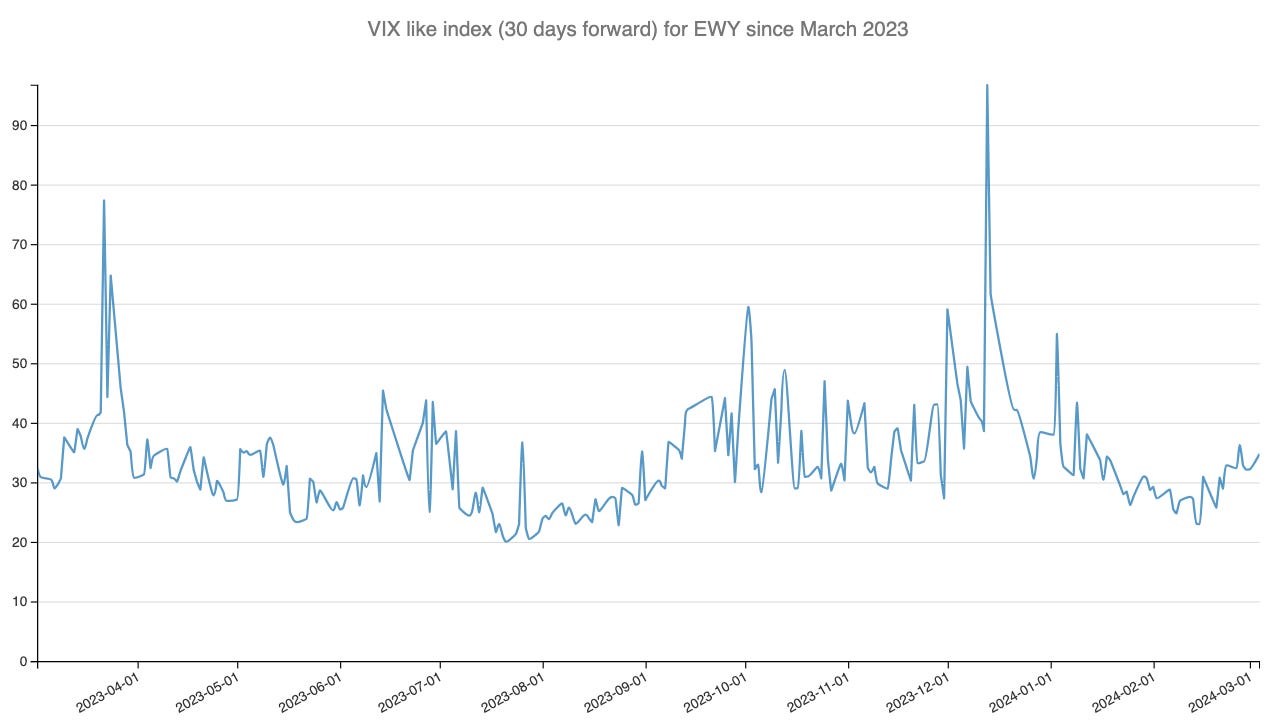
A reconstitution of a VIX index for EWY over the past 12 months shows that we are not in a turbulent period like what we’ve observed in Q3 and Q4 2023. However, sitting at almost 35 signals that the prices of options are overestimating the realized movement in the underlying.
This opens opportunities for short volatility sellers. Let’s have a deeper look.
The data and the trade methodology
Combining the two charts above, we can get a sense of the Variance Risk Premium in EWY over the past 12 months.


