
Forward Note - 2025/10/19
Where is the pain side?
Happy birthday to my mom, my first fan in everything I do. I love you very much.
What a week it has been. Not that indices lost tremendous ground: all in all, the S&P 500 and the Nasdaq 100 are pretty much flat, and even had the audacity to add a little more than half a percent after we left both bruised on Friday. To add to the impertinence, we are only about 2% away from the all-time highs.
So why all the noise and the fury?
For once, the VIX was the star of the week, offering a proper ride for their money to many traders. For some, it was only cold sweat rolling down their back as we approached the anniversary of Black Monday. For others—especially those trapped in the black hole of 0DTE—it was an actual torrent.
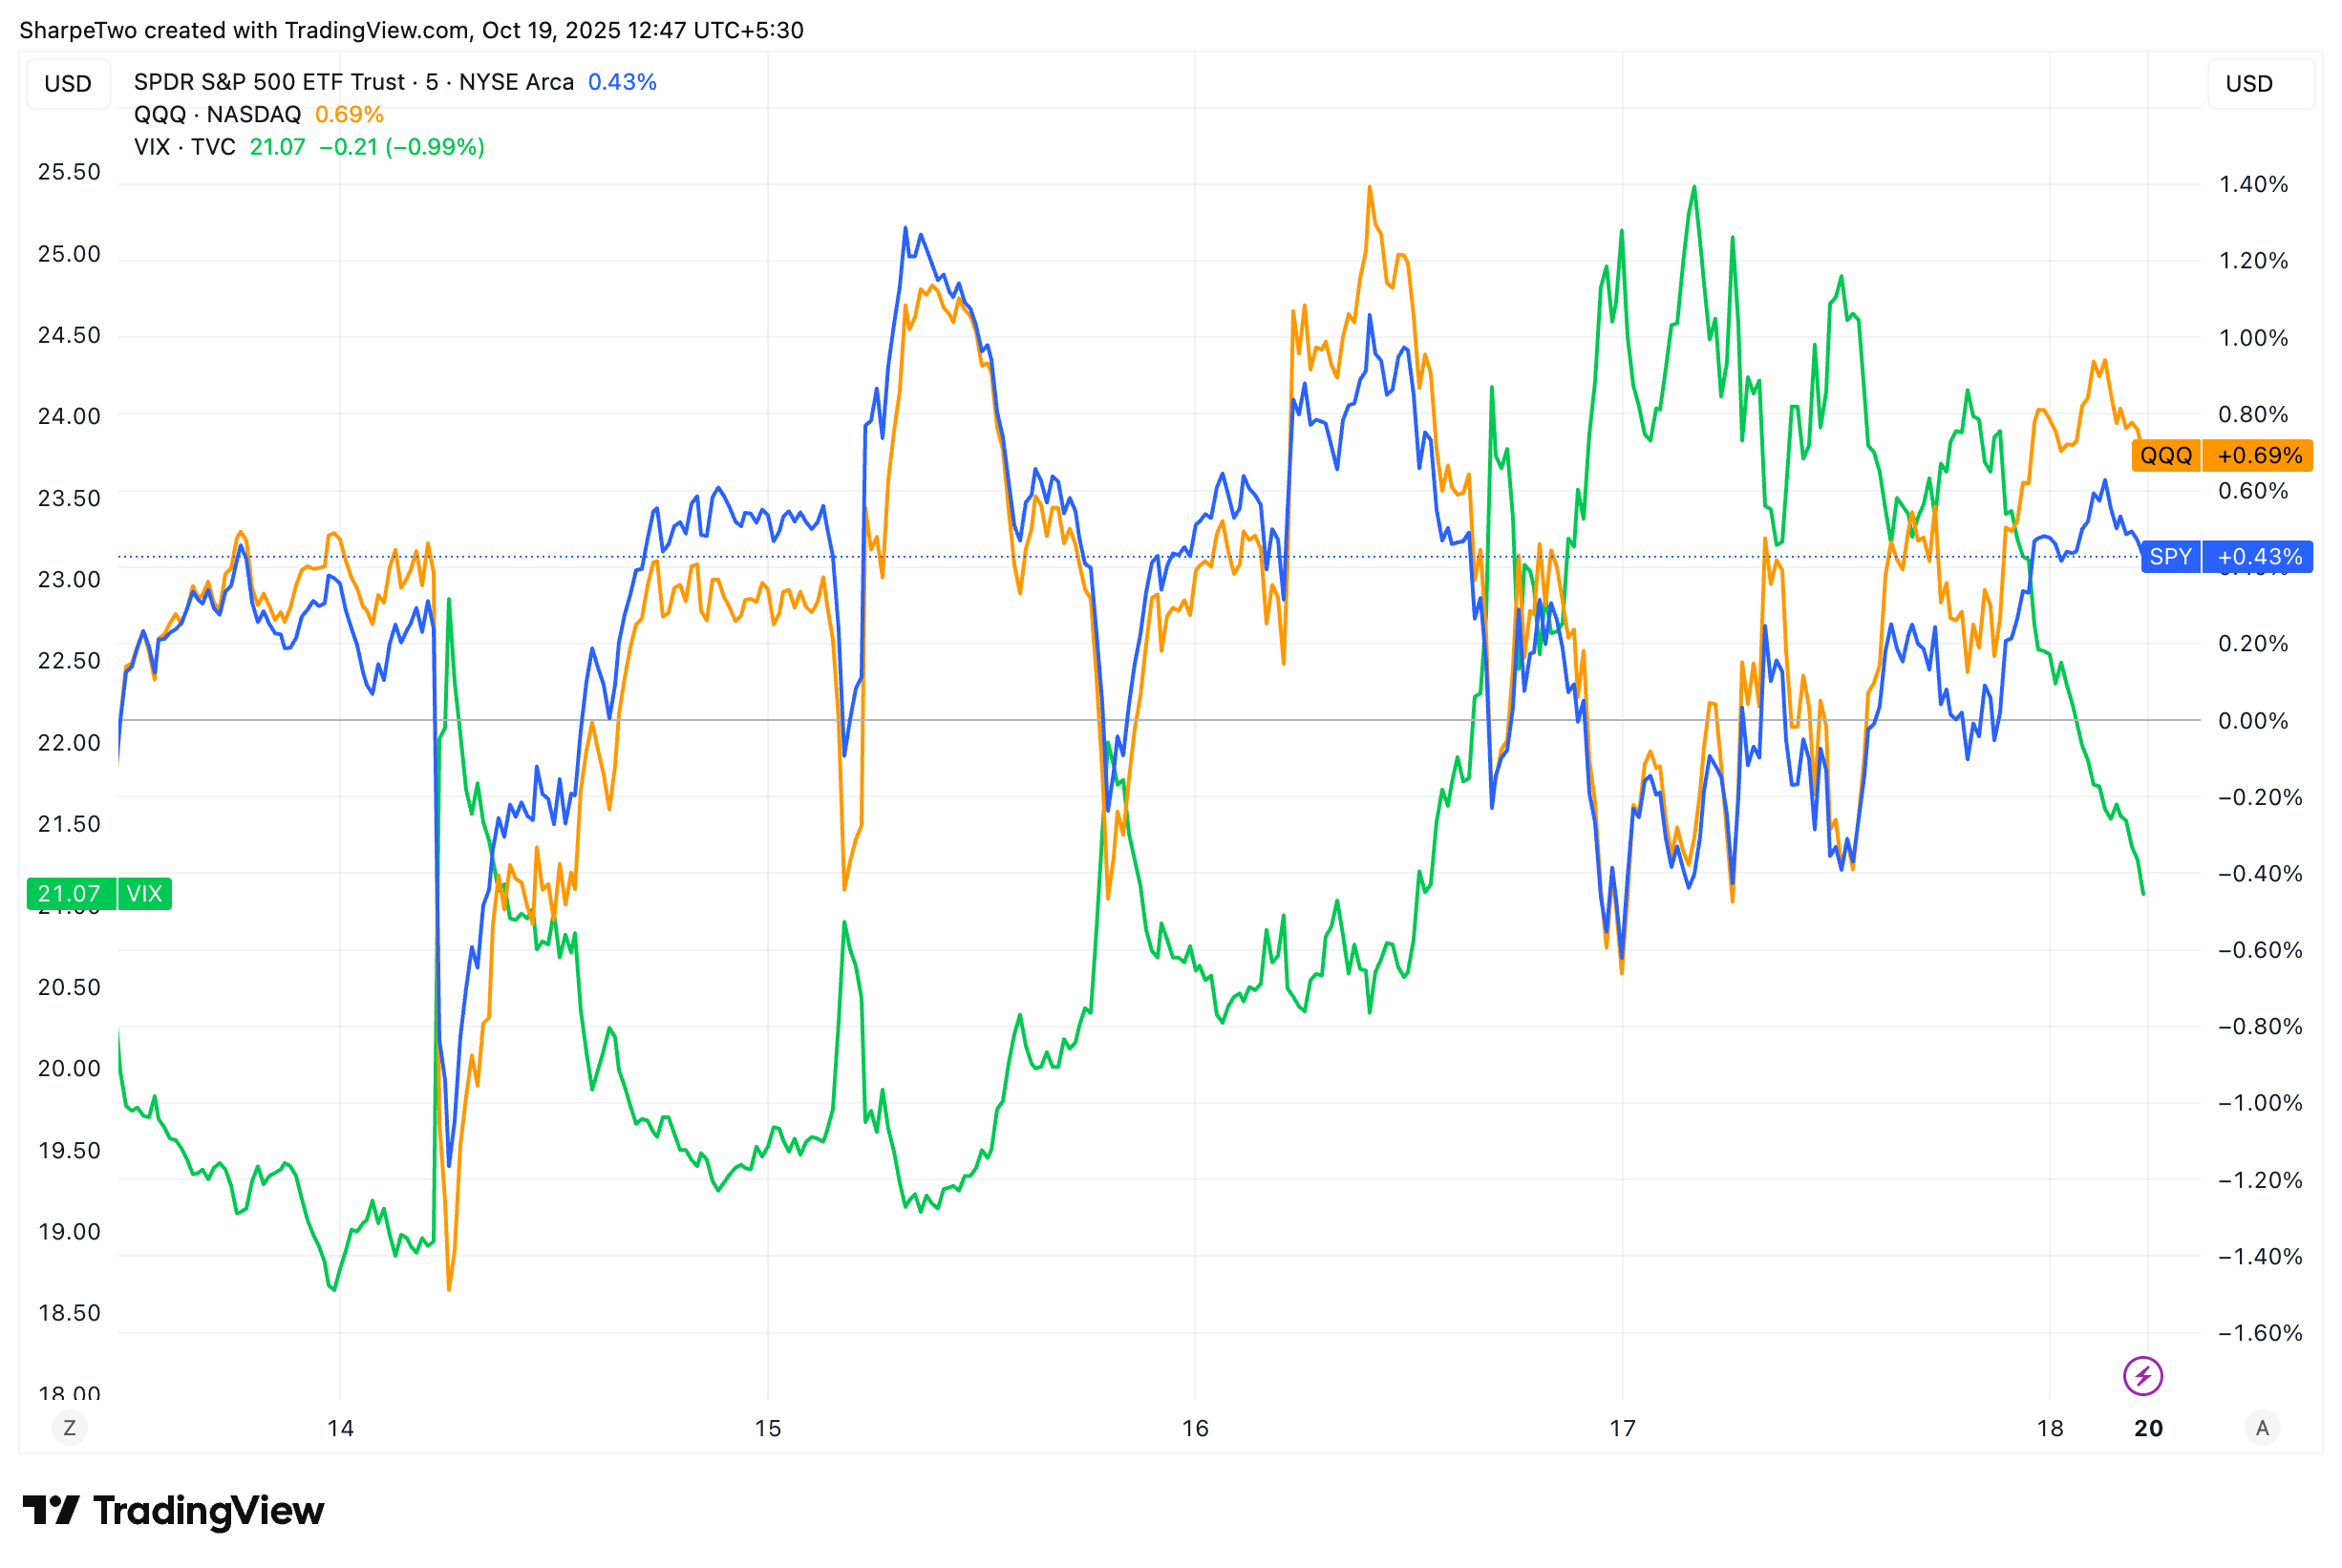
A range of about 10 points from the intraday lows on Monday, when it looked like markets would quietly resume the drowsy drift observed since June, to the premarket print on Thursday, as traders digested another round of China–US trade tensions and rumors of an imminent bankruptcy (!!!) among regional banks entangled in the First Brand scandal.
Needless to say, emotions were running high. While we often say that VIX 16 tells you everything you need to know, VIX 25 at Wednesday’s close definitely had our attention.
First of all, because once again, we were wrong. We were expecting to see VIX 12 before VIX 25, especially as we moved closer to Thanksgiving and the year-end period when markets are traditionally quieter. But in a headline-driven market, all it takes is a tiny spark for the entire marketplace to light up like wildfire.
So what to make of this? First, the obvious: the market may have ended flat, but realized volatility this week was very much in line with the steam seen all over social media.
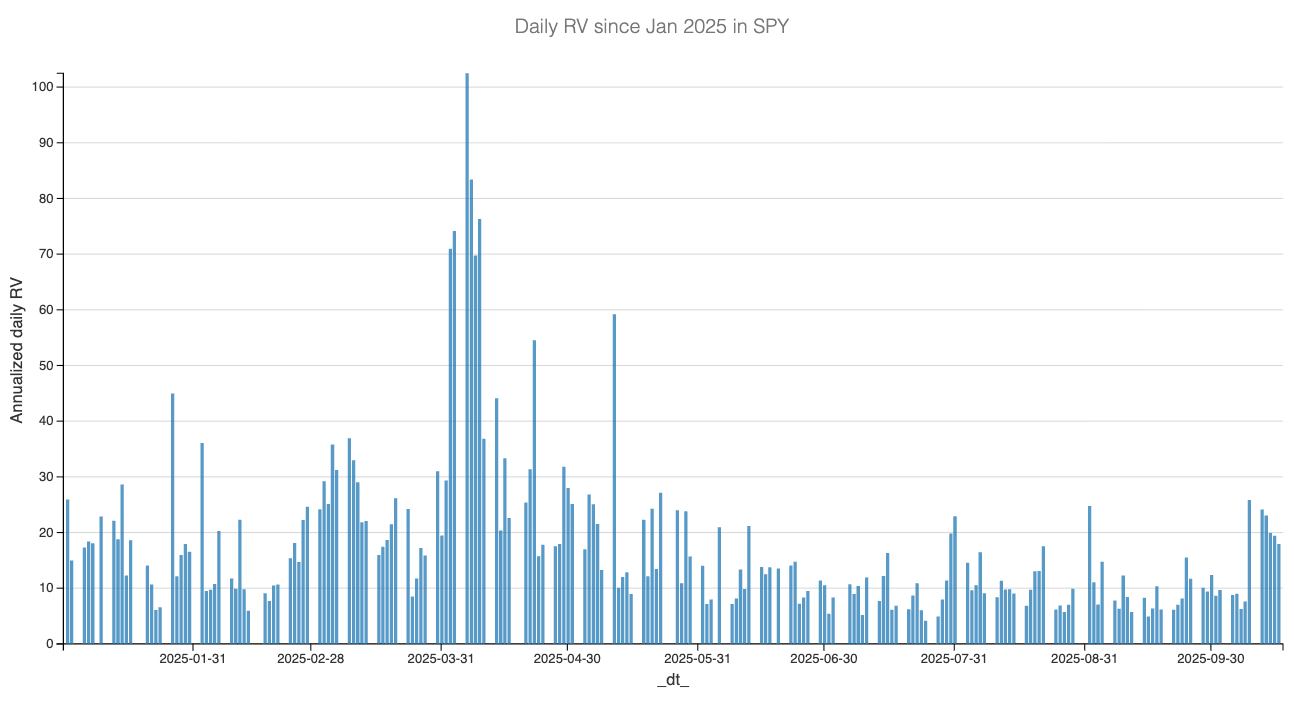
We ended last week wondering whether Friday’s move would prove to be just a short-lived phase or the start of something deeper. We now have our answer. Volatility tends to cluster, and until we see a few calm days in a row, with realized volatility back below 10%—like what we observed over the summer—it is fair to assume that daily swings will remain a bit more intense over the next few weeks.
And there are catalysts for that. Between the ongoing lack of resolution over the government shutdown, the next FOMC meeting coming up in ten days, and an earnings season where a healthy dose of schizophrenia will push investors to look for any reason validating the bubble economy, one should expect a bit more stress.
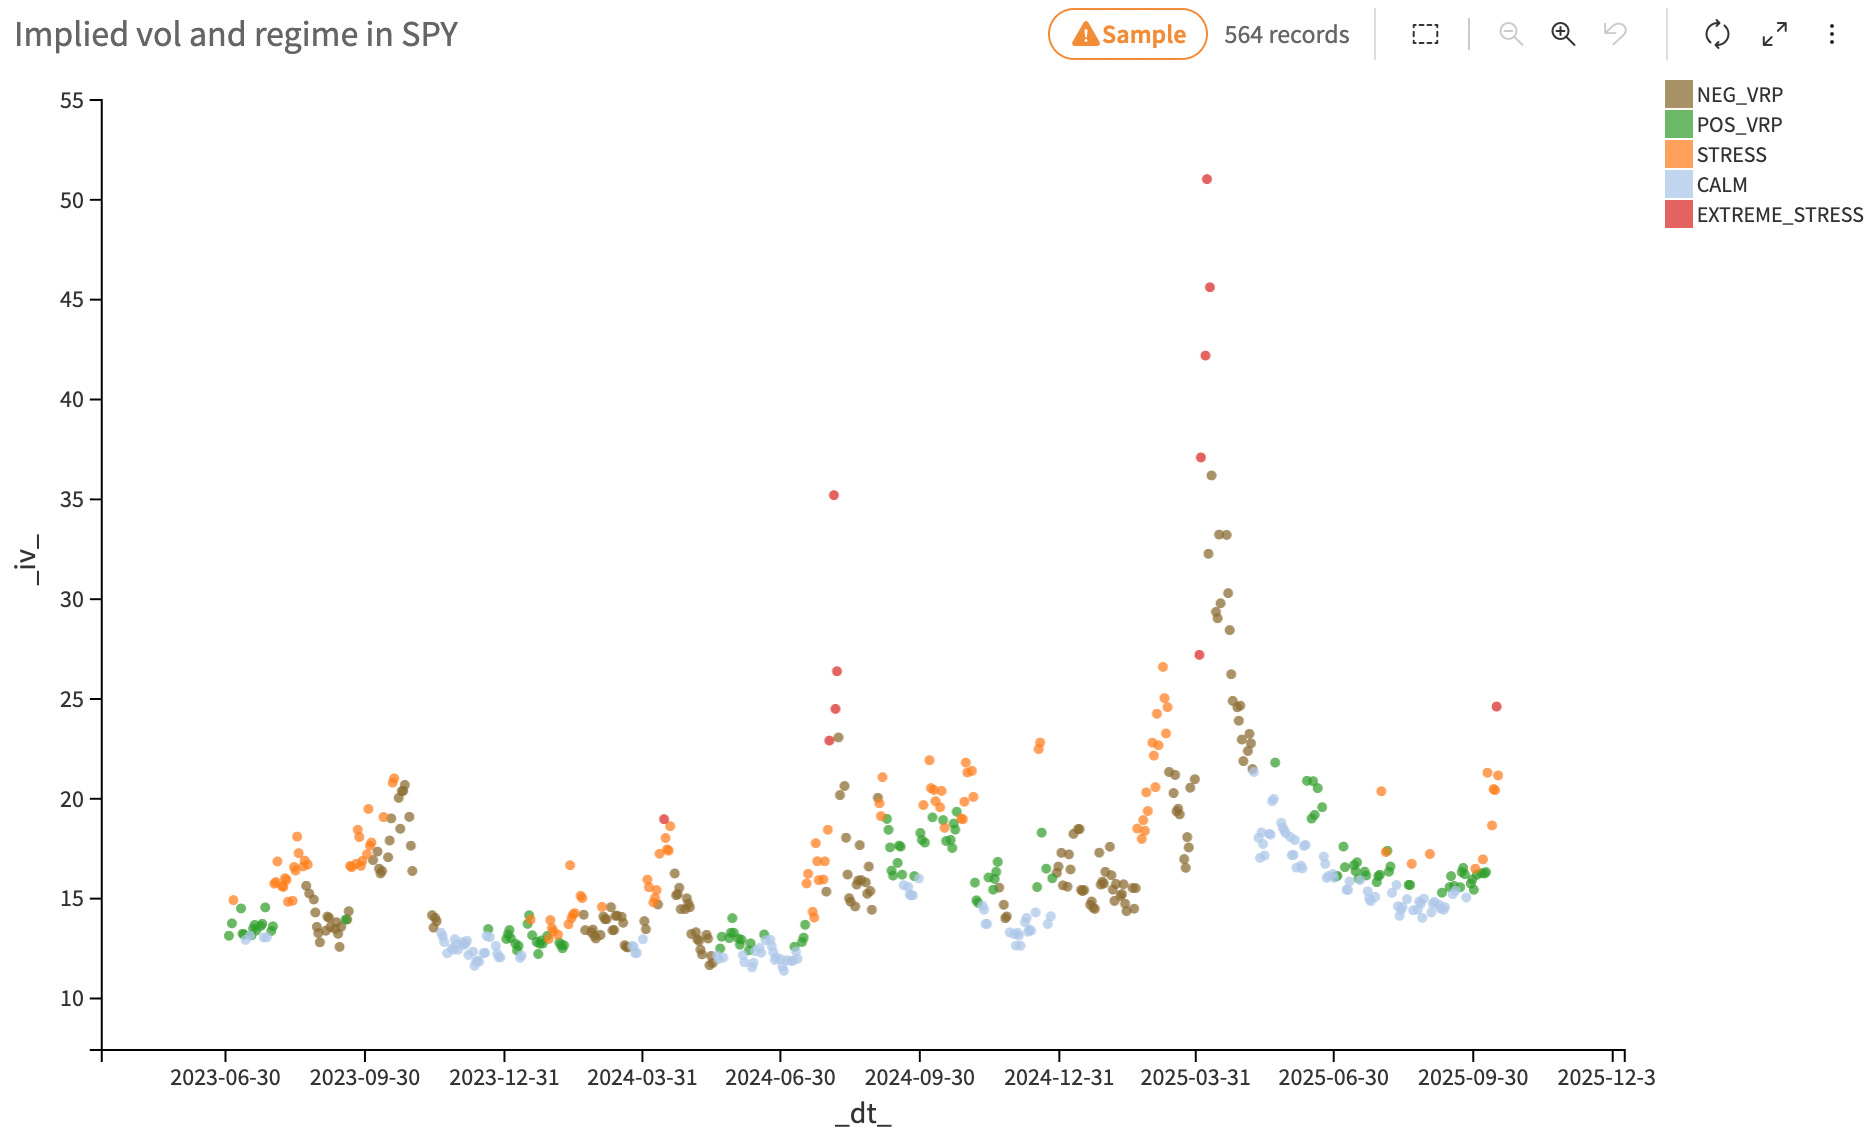
On Thursday, stress levels were even classified as extreme, particularly as vol of vol went all over the place and the market began repricing downside risk far more expensively than it had all summer.
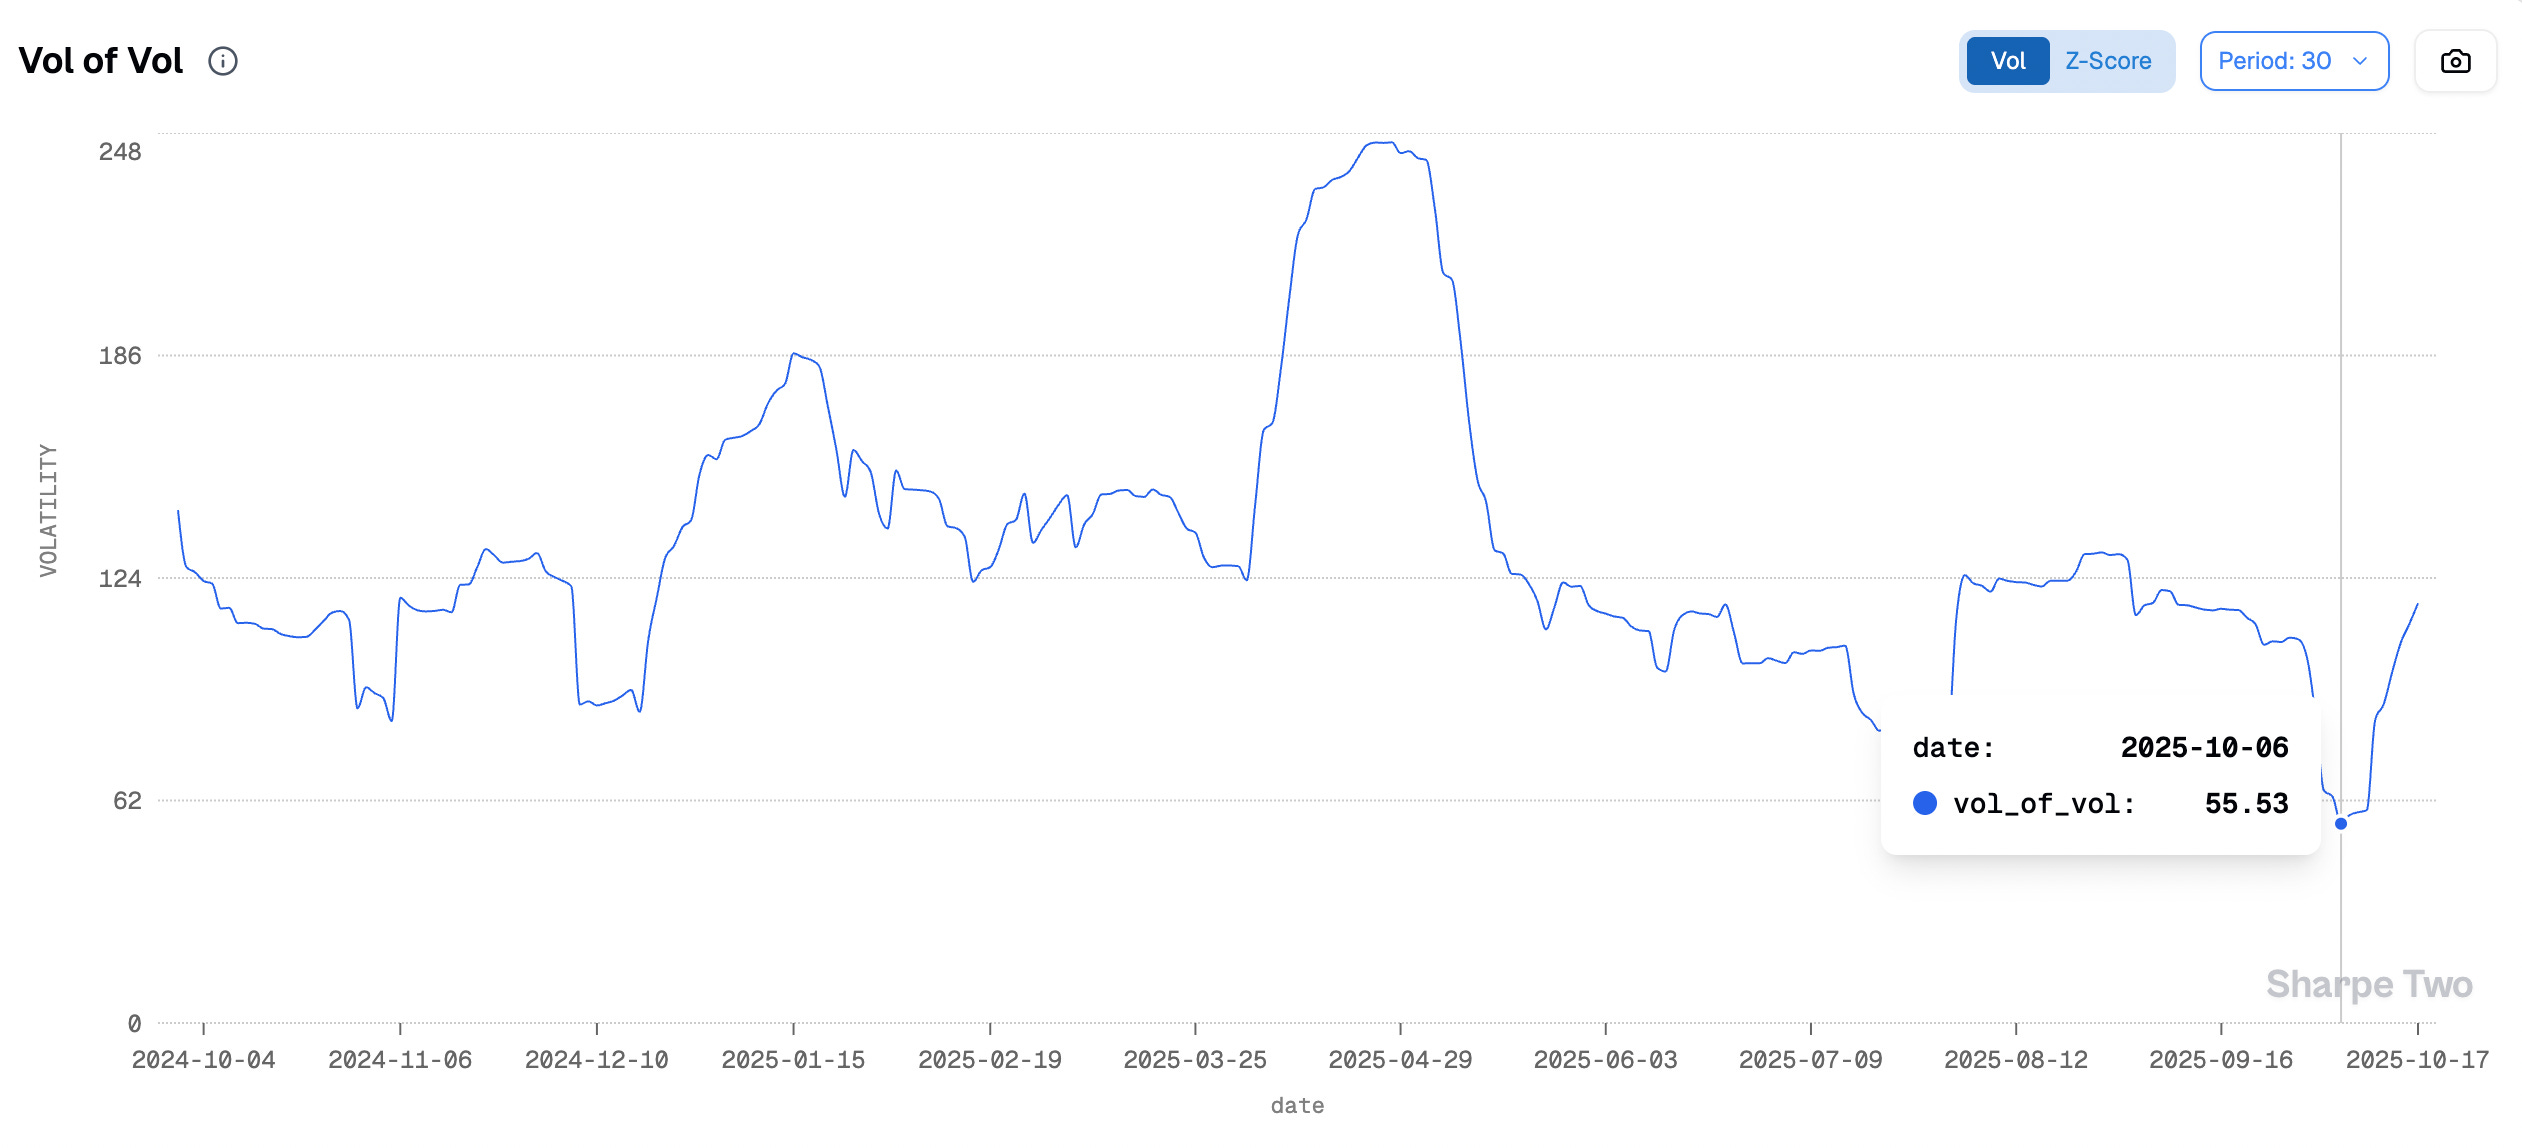
From 55 in early October to 117 is no small feat—and once again, something worth paying attention to. One needs to quickly recalibrate expectations of how much the VIX can move in a single day. (As a reminder, volatility of implied volatility is nothing more than a normalized measure of the standard deviation of VIX returns.) And as it stands, there is no indication that this number cannot keep climbing, at least for the next couple of weeks.
Now, is there any legitimate reason to panic? As we repeated several times in the Discord this week: if you felt uncomfortable after this volatility whipsaw, it is a good reminder that you may be trading too big—or that you lack wings in the back month. A hedge three to six months out would have definitely helped to smooth the blow and keep a cooler head when VIX flirted with the high altitude of 30.
In situations like this, we like to look at sector ETF volatility to see whether the stress is concentrated somewhere in particular.
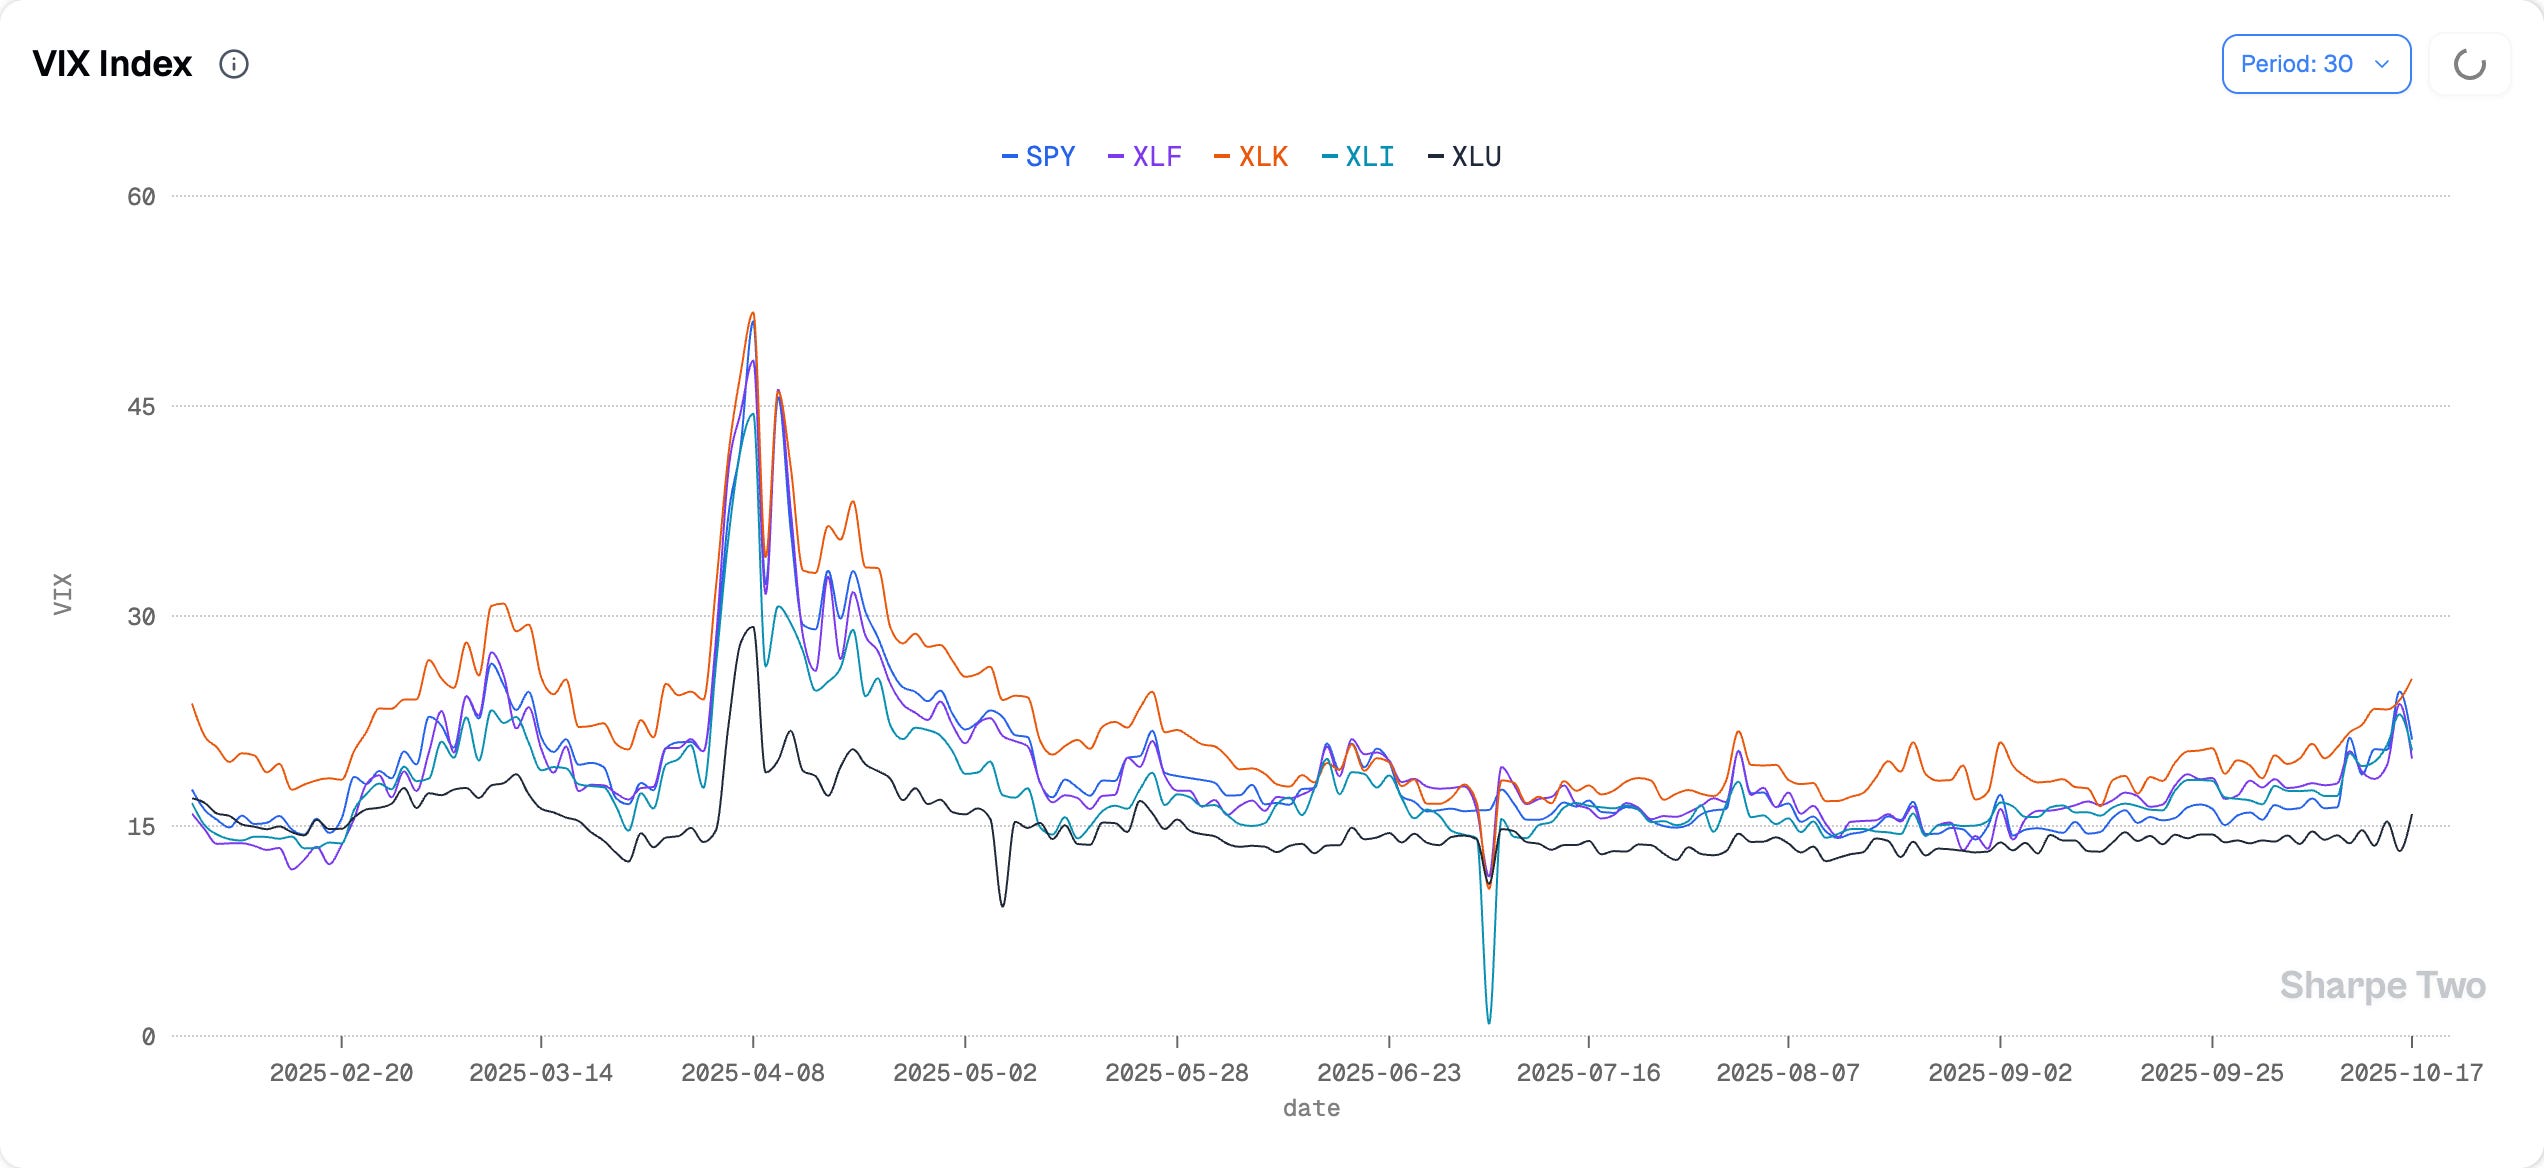
SPY and XLF volatility have been moving in sync over the past few weeks, and particularly this one, as banks began reporting earnings and attention swung back to regional lenders. Systemic contagion was back on the agenda as the market assessed the fallout from the collapse of First Brand and wondered how many skeletons were still hiding in the closet.
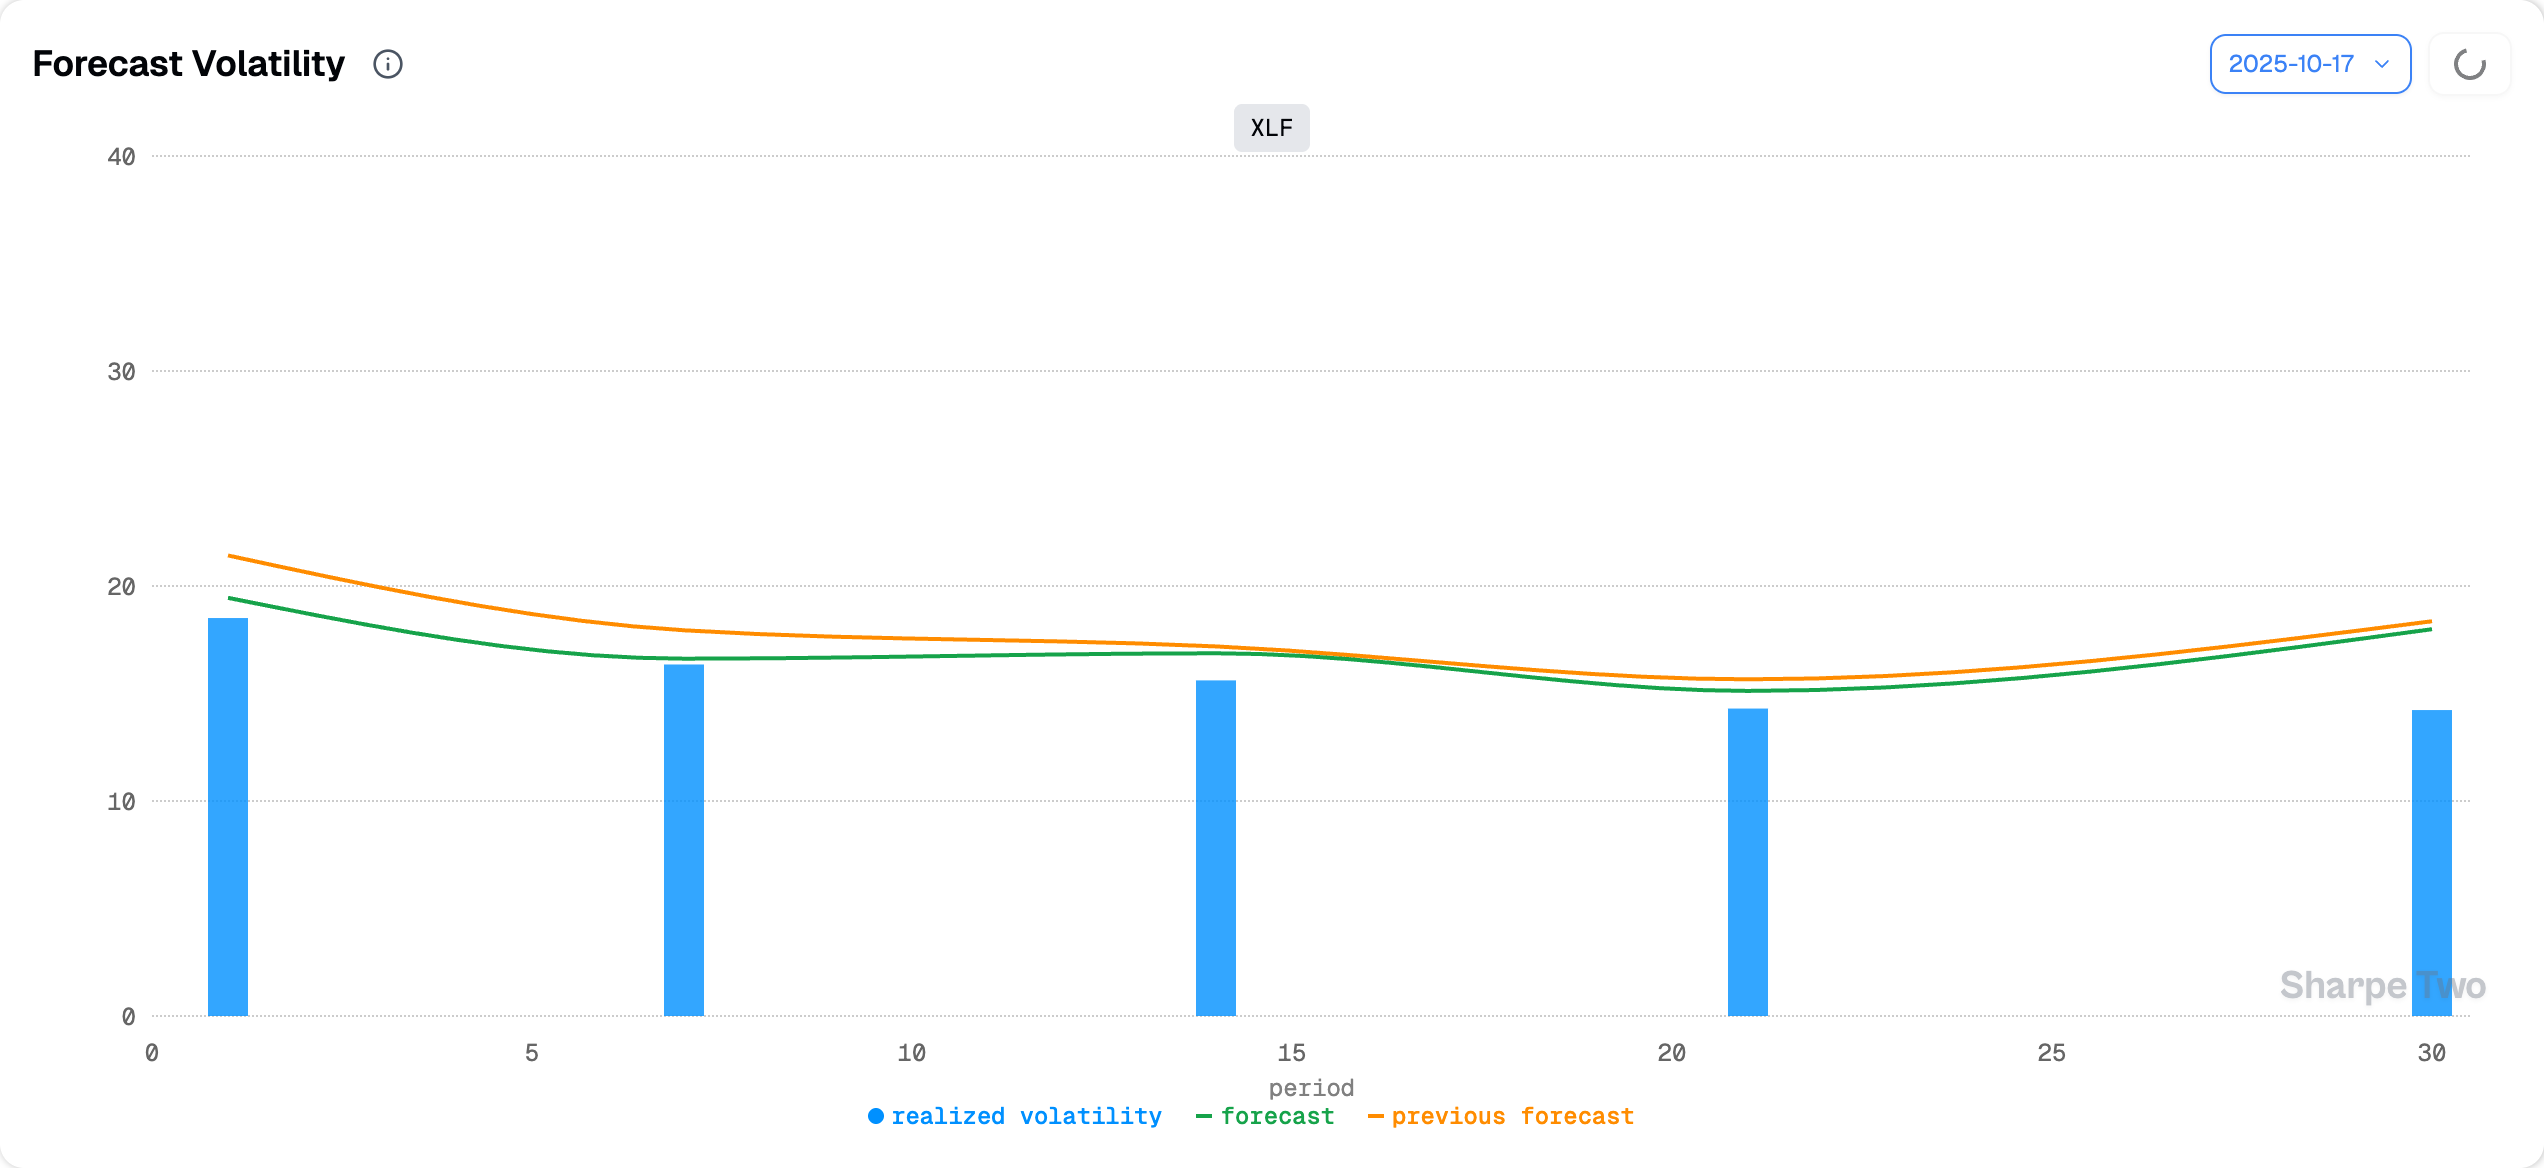
Things cooled off on Friday, but XLF at 20 is something to watch. If contagion fears proved valid and we were on our way to a replay of March 2023, that cushion over realized volatility would wear thin very quickly. We are not there yet, but we still forecast roughly 18% realized volatility in XLF over the next month.
Should this deter us from selling insurance? Everyone has their own risk tolerance, obviously. But let us rewind to the sectoral VIX picture. XLK (technology) is now pulling implied volatility higher as we head into earnings, and considering the weight of the “Mag 7” in the index, that gives another rational explanation for why the volatility complex was … quite volatile since last week.
And one needs to question what happen to the same vol complex when TSLA (10/22), META, AAPL, AMZN, and GOOGL (10/29–10/30) have reported—and the FOMC is over…?
We also believe that the wilder swings in implied volatility will present attractive opportunities for those on the sell side. Assuming no major headlines hit the tape—admittedly a tough assumption in a market where one is constantly asking, does the market know something I do not? Am I simply renting my account to those rushing for the exit because they already know something is about to hit the newswire?
Yet, with VIX at 27 in premarket on Thursday, hindsight makes that trade look obvious. And that hindsight is a little unfair—so let us rewind for a second. The reason we trade volatility is because it tends to mean-revert, unlike equities, but also because we can gauge its intrinsic value against realized volatility.
We would certainly not encourage anyone to go all-in during a stress episode or volatility spike, but the burden of proof still lies with the bearer of bad news. So far, we have not learned anything new or remotely close to a breaking point. And as long as we keep mechanisms in place to stay disciplined (buy these 6 months wings!!), VIX 27, when realized sits around 12 and is projected to reach 18, is still a trade worth taking. It is not without risk, but it leaves a healthy margin of error in case something does happen.
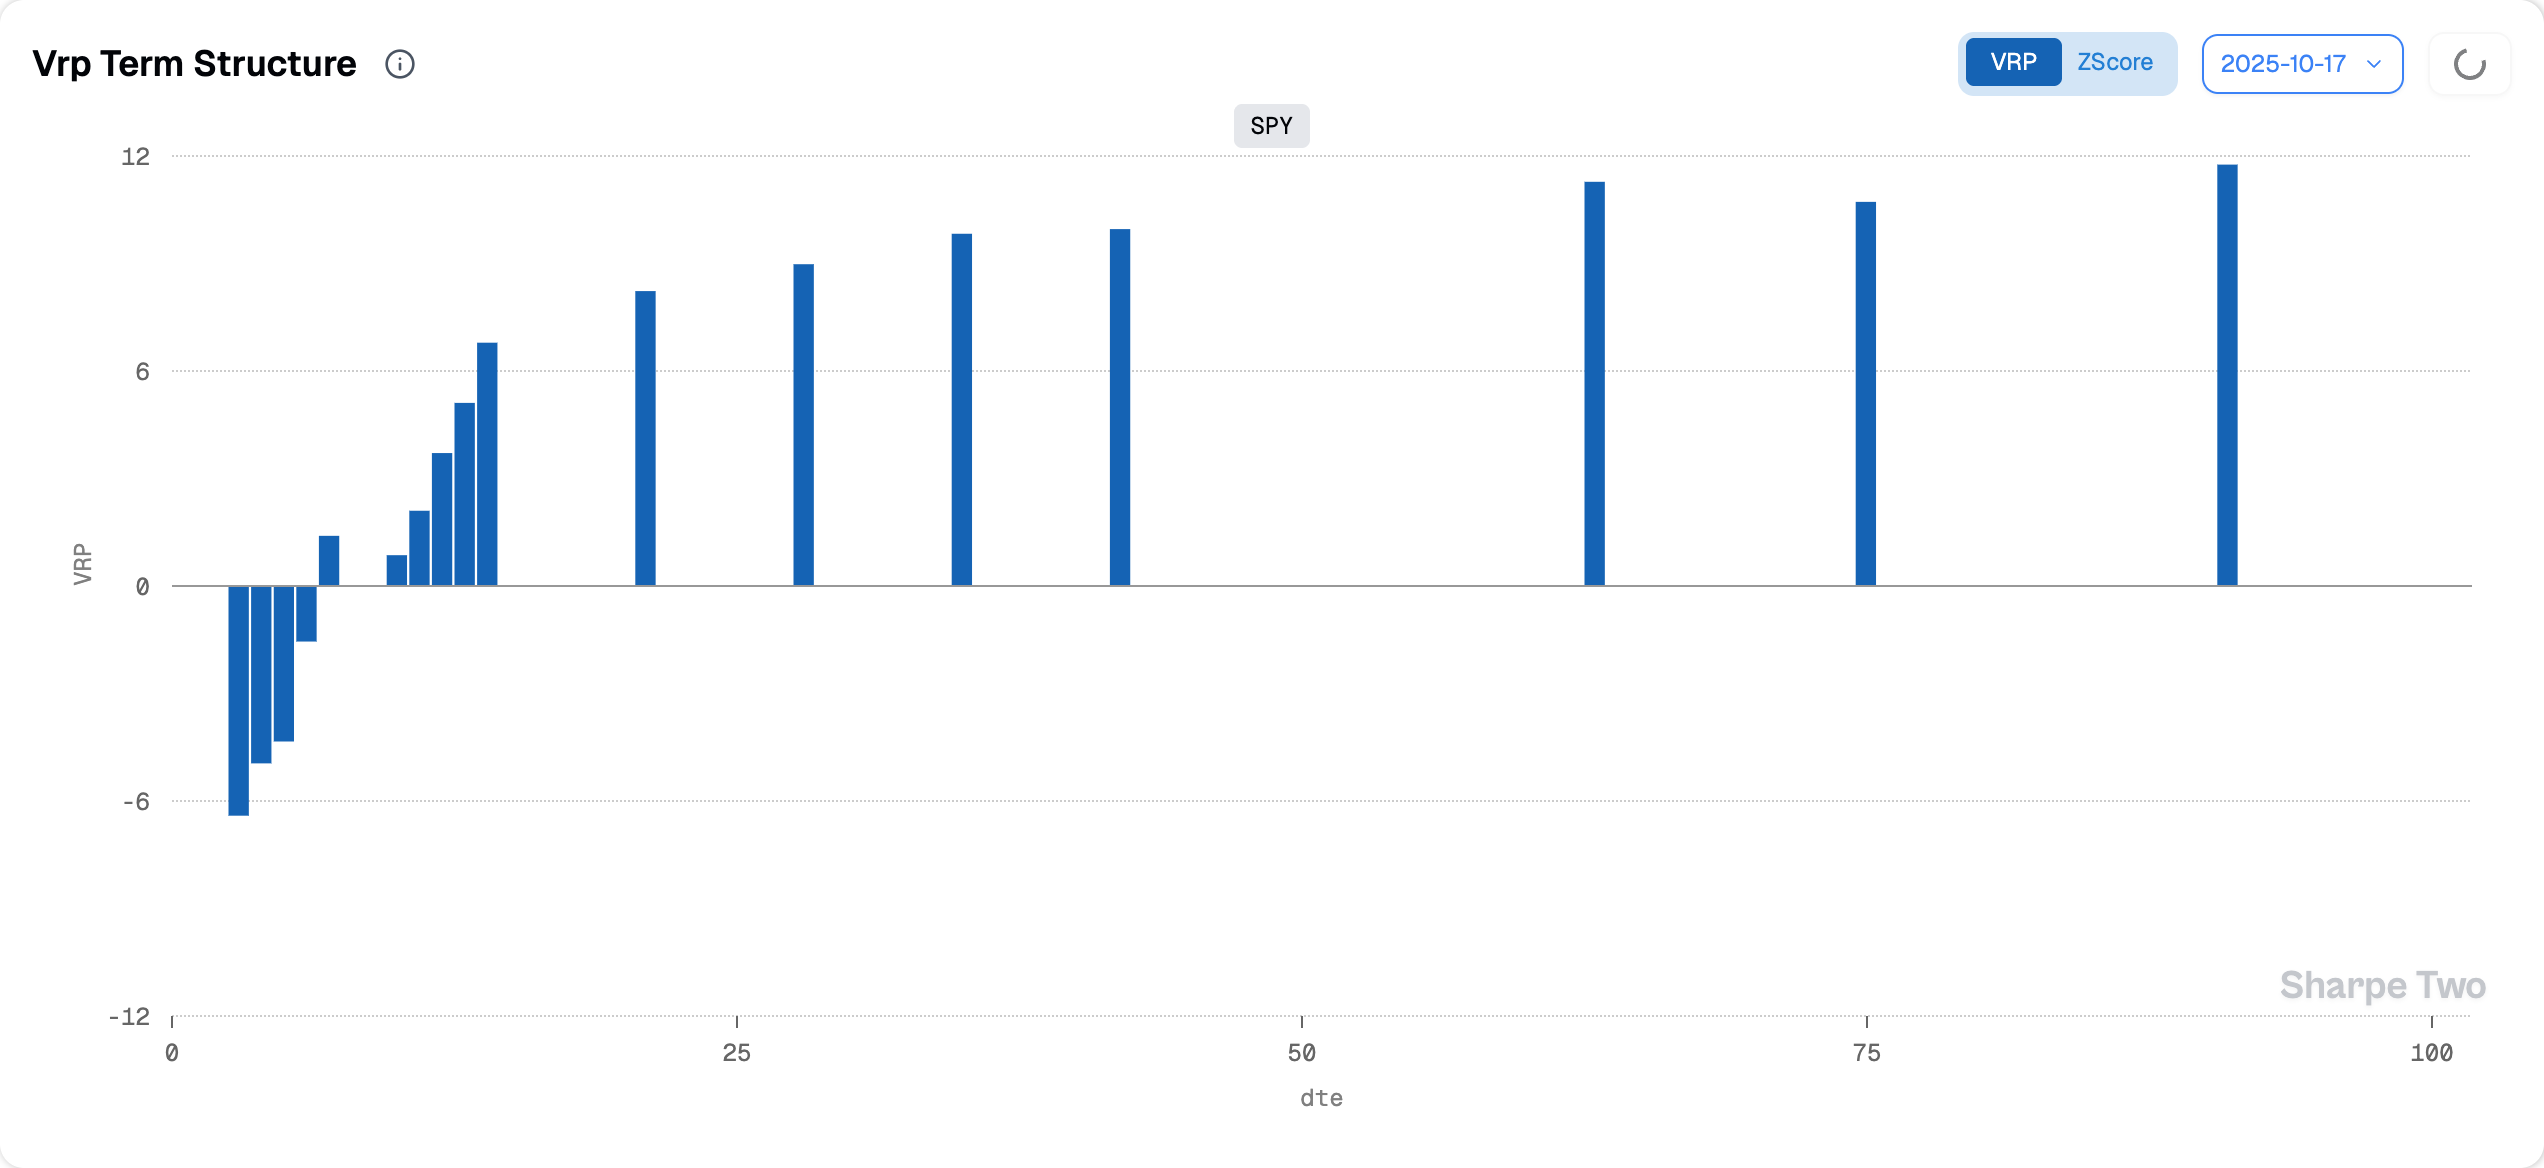
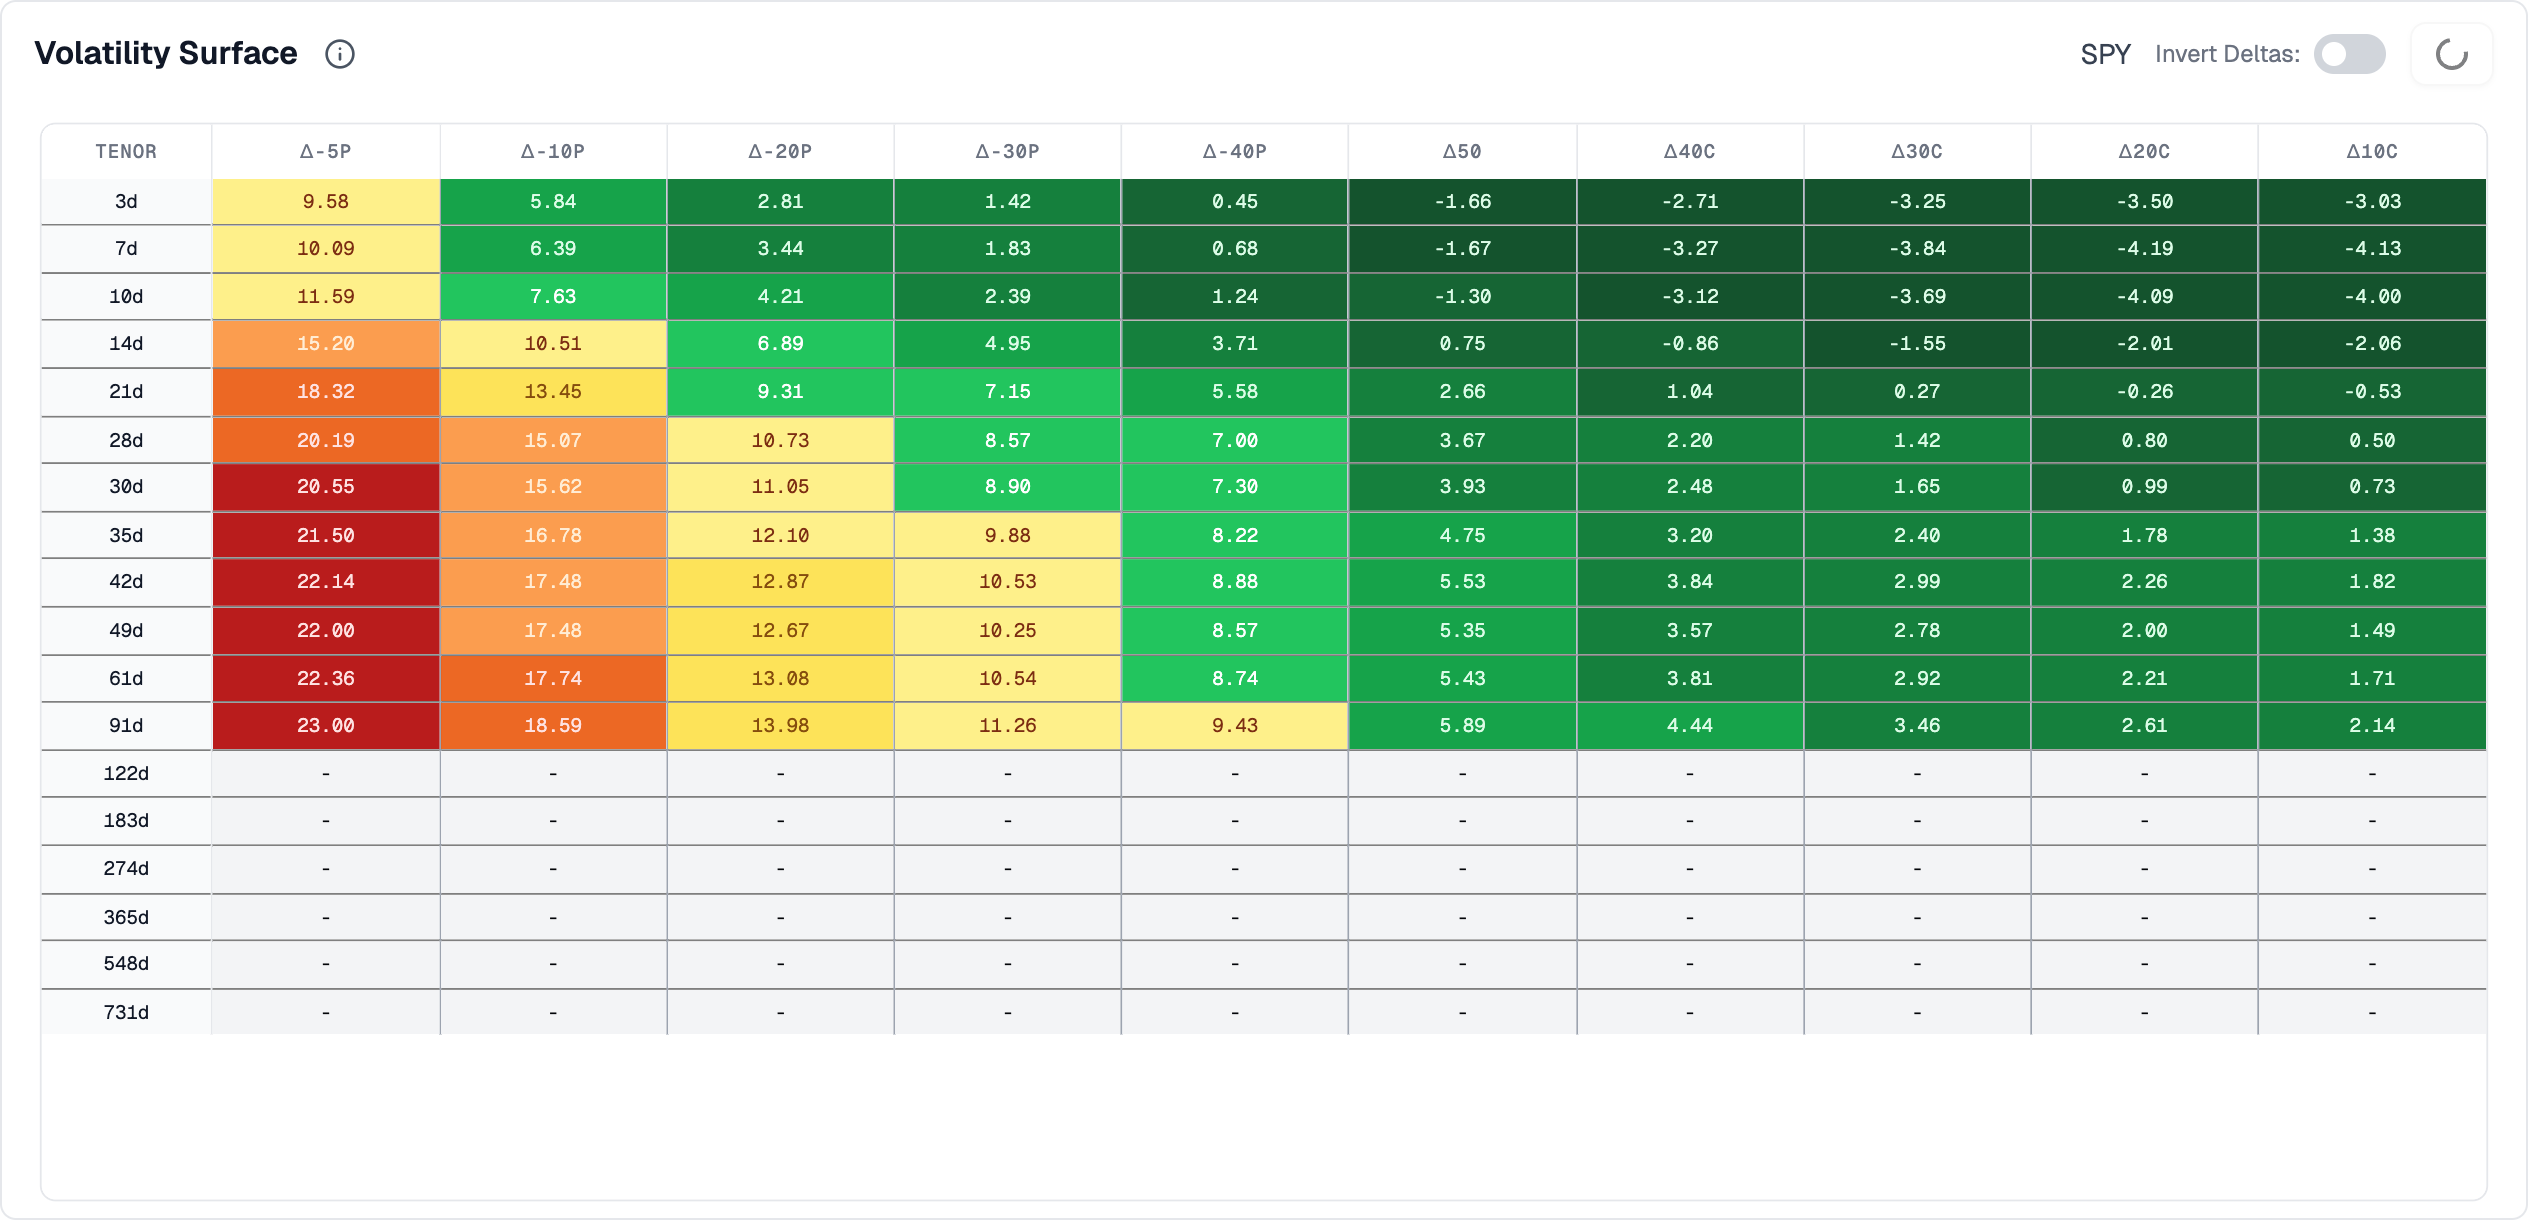
The volatility surface at Friday’s close did not tell a different story—just a more granular one. Twenty-delta puts in the 30–60 DTE range remain particularly expensive; twenty-delta calls at 20 DTE, a little less so. As usual when things are this distorted, be very mindful of what you buy and what you sell, because the real risk may not be where the rest of the market is looking.
Think about it for a second. Is the market more prepared for a violent downside move triggered by some headline—or for a robust 5% rally that pushes us toward 7,000 once the headline risk dissipates, tech earnings are behind us, the Fed cuts rates, Xi and Trump are photographed together, and regional banks (for now) reassure on the state of their balance sheets?
Pick wisely.

In other news
What is happening with gold? It is now up 60% year to date, and 15% (!!!) over the past month. It could even have been closer to 20% if the risk-off sentiment had not faded on Thursday—which means we were extremely close to a 10% (!!!) move in a single week after touching $4,000.
A healthy reminder that the “impossible” tends to happen more often than not in financial markets—regardless of period or asset class. Let us start with the period in time, and this rather à propos interview from Jim Simons that has been resurfacing all over social media. The authors of those tweets and threads imply that gold is due for a correction (as per King Simon), and that one day it will lose 25% and leave investors holding the bag. Sure thing, fellows. But what that same interview also suggests is that gold can easily rise another 25% before losing 25%—and as Simons himself put it, it is the mix of “luck and common sense” that spares you the blow.
We like to think of ourselves as rational investors—plenty of common sense, not much luck. Yet it is most likely the other way around. The sharpest macro view without the right (lucky) timing is often worthless. Mike Burry himself would not tell you otherwise.
Which brings us back to the same conclusion as above: where is the real pain? Gold 5,000 or 3,500? S&P 6,000 or 7,000?
Pick wisely.
Thank you for staying with us until the end. As usual, here are two interesting reads from last week:
Emotions ran high, and it is always useful to read opinions that may sound extreme but carry real conviction. We are prisoners of our own skull, and these theses break through the prison walls for a few minutes. Here is a great piece from Quoth the Raven . We do not agree with everything, but some parts are particularly on point.
Kenny G has a message for all those looking to use Gen AI to find alpha: it is not that straightforward. Yes, it is a productivity boost—after all, Olga is nothing more than a retrieval LLM connected to our data—but we remain skeptical about the flood of SSRN papers claiming miraculous results with LLMs. It was already difficult enough to replicate results with numerical algorithms. How is that supposed to work with non-deterministic functions?
That is it for us! We wish you a wonderful (TSLA earnings report) week ahead, and as usual, happy trading.
Ksander