
Forward Note - 2025/10/12
You didn't like VRP 6? How about VRP 12?
And there we had it. After a quiet Friday morning, where curiously many tickers were quoting a little wider than usual at the open and before any news hit the floor, the S&P 500 finally dropped almost 3% in a single session — the first time since April. Needless to say, the main equity indices finished the week deep in the red, while VIX added five points to close at 21.66.
So what exactly happened? Two days after a rather aggressive — yet almost swept-under-the-rug — announcement from China on mineral export controls, Trump threatened to slap an extra 100% tariff on Chinese goods unless the country returned to “more reasonable terms.” In his fury, he also declared that the planned meeting with Xi Jinping on the sidelines of the Asia-Pacific summit in early November was pointless — before walking it back slightly.
In a week when markets were already transfixed by the surge in gold and China’s relentless accumulation of the metal — with all the speculation about motives — this was the perfect spark to set the marketplace on fire.
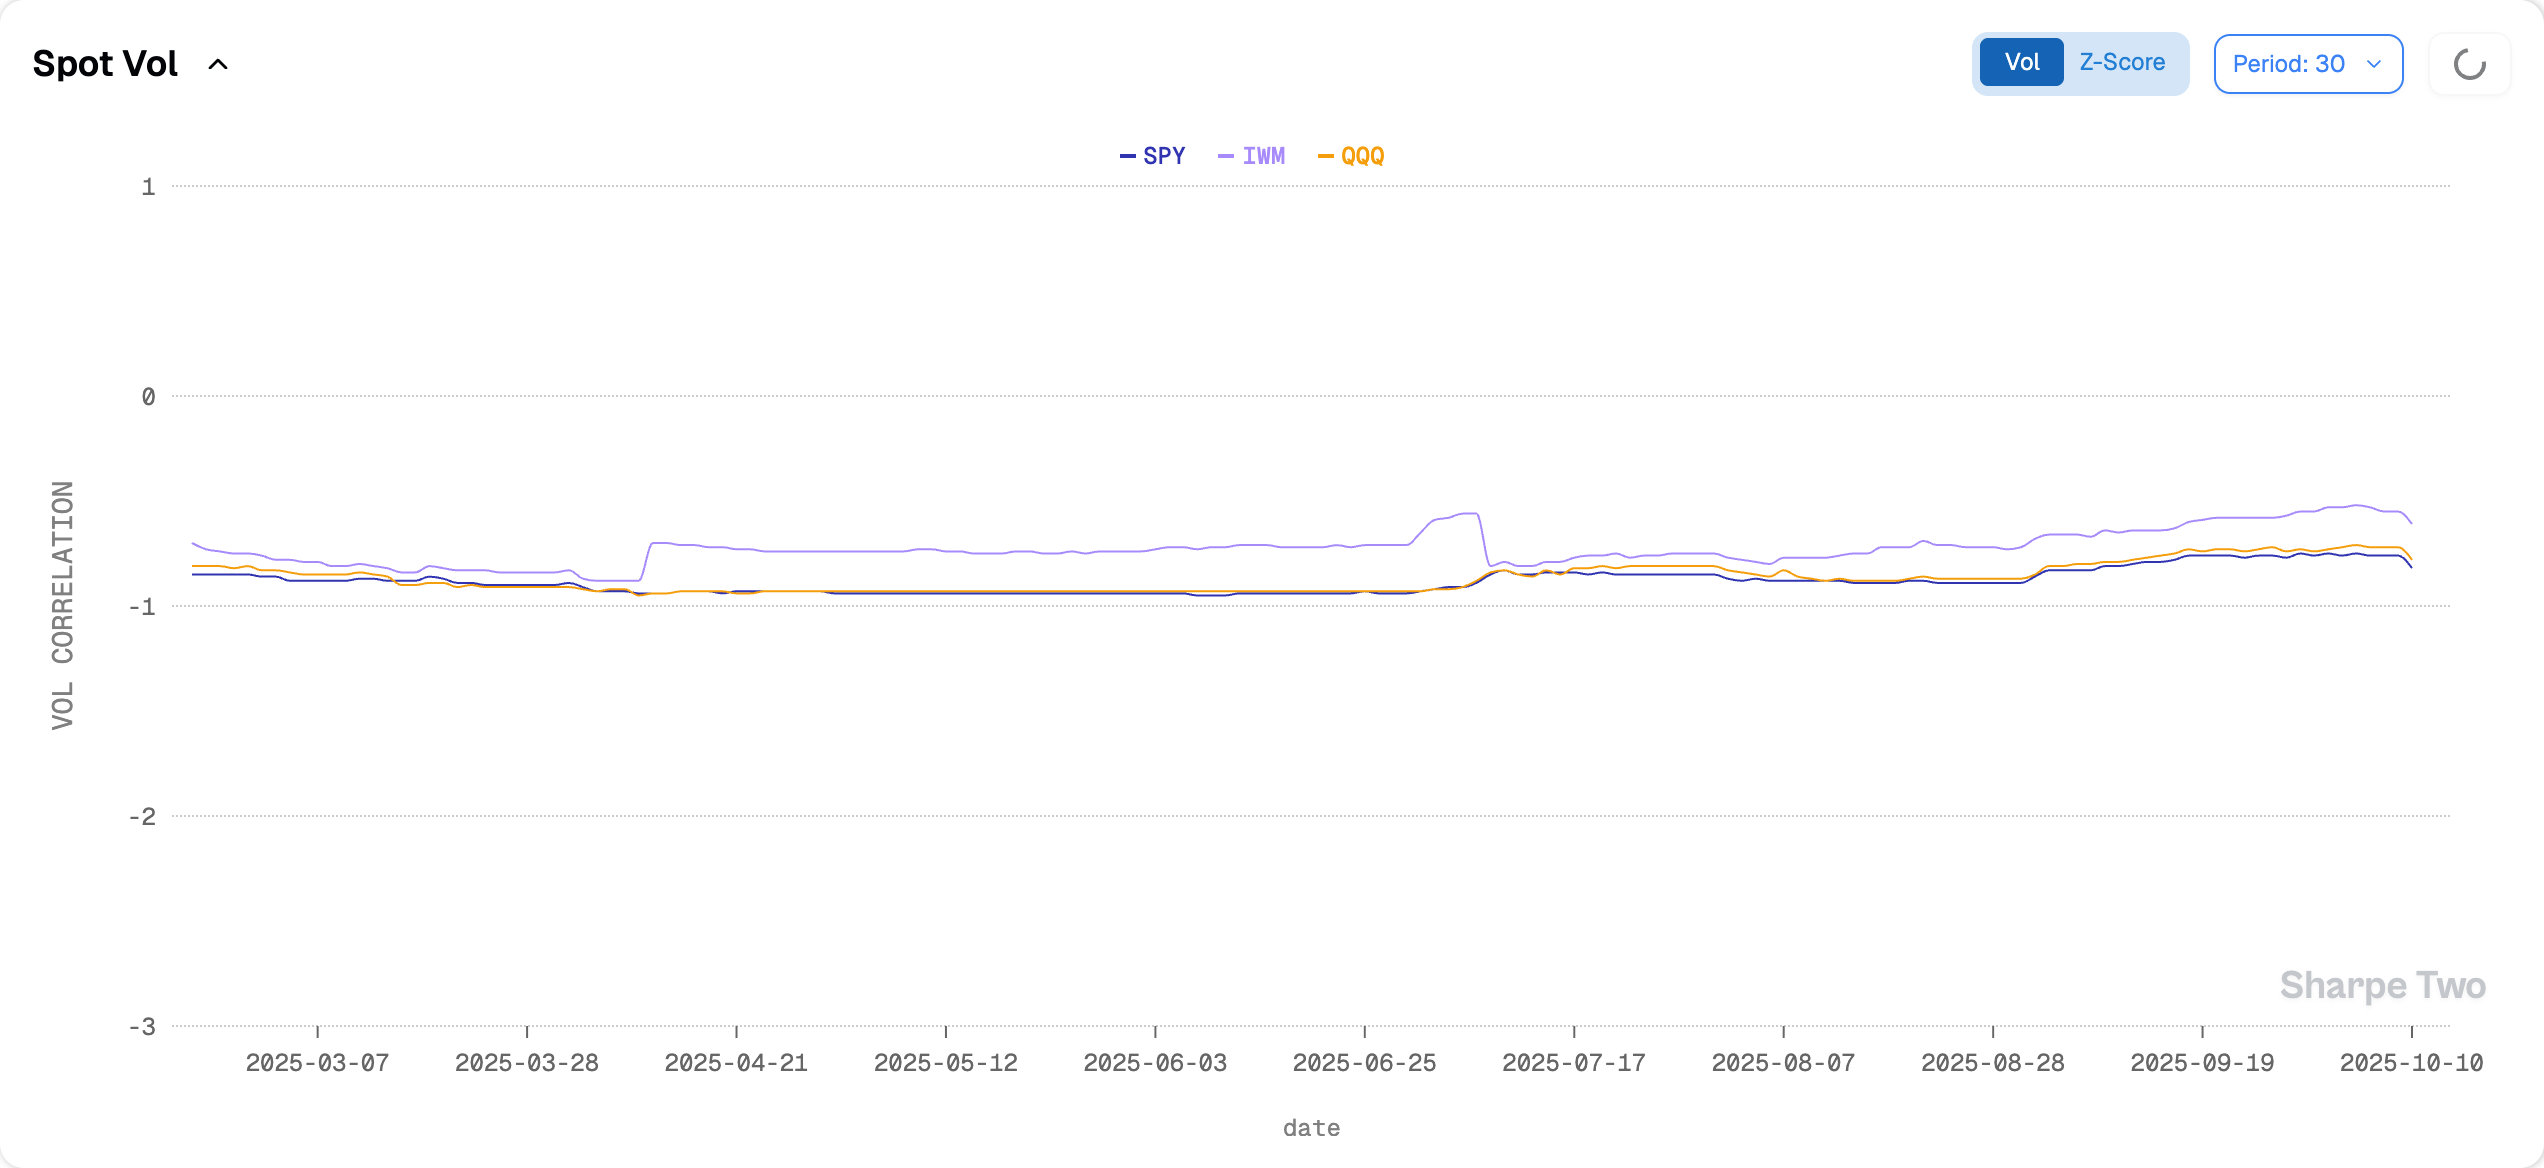
Let’s start from the obvious: a five-point vol move from 16 is respectable and the spot-vol correlation dipped this week, showing that the market finally feels like hedging downside moves — a clear shift from the complacency that defined the summer structure. It signals that participants are now paying attention. Between the looming government shutdown and renewed tension with China, the next few days and weeks will tell whether this is just another episode of 2025’s favorite pattern: escalate, then de-escalate.
And to answer that question let us indulge in a bit of macro speculation. Is America really better equipped for an arm-wrestle with China in October 2025 than it was in April, when Secretary Bessent said that “a full-blown tariff war with China was not sustainable”? The answer seems obvious. If anything, China now needs the U.S. a little less than it did back then: it has explicitly cut ties with NVDA, promoted domestic champions in semiconductors, and spent months hoarding rare earths — and lately, gold. Still, a 100% tariff would carry dramatic consequences for its export-driven consumer base. So, back to April’s question: if it did not break then, why would it now?
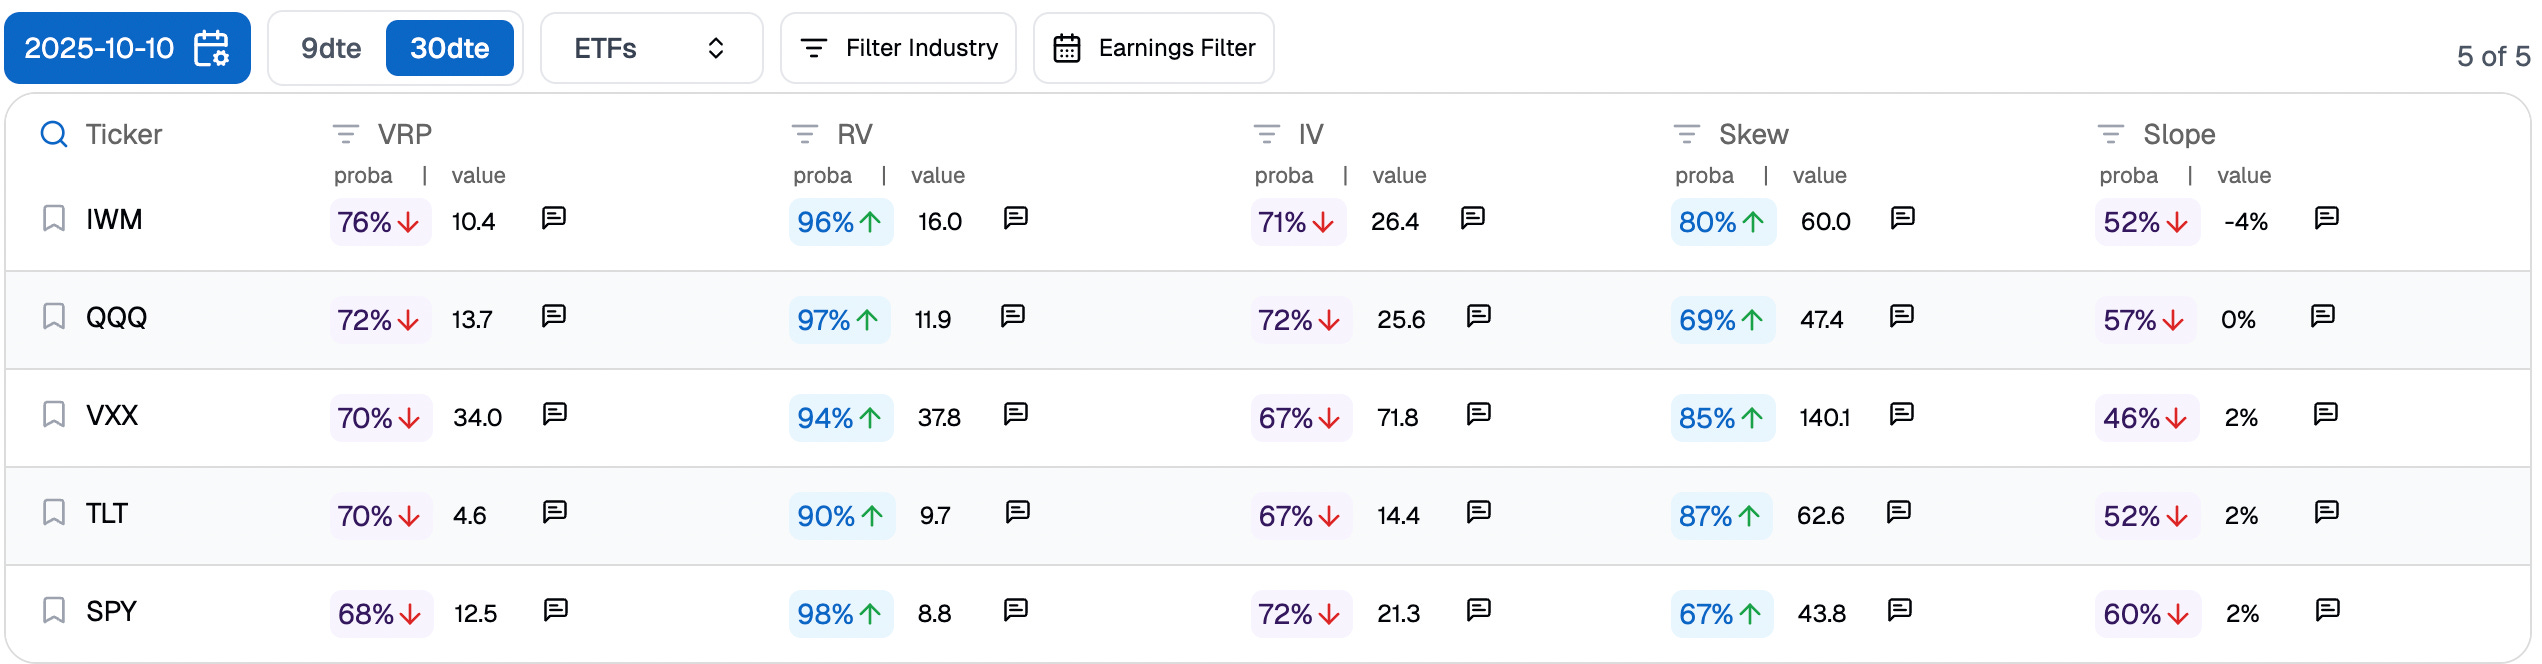
Unlike in April, when realized volatility was already high and any VIX acceleration merely mirrored existing turbulence, this time a very healthy variance risk premium was baked into the price. By Friday’s close, the one-month VRP stood at no less than twelve points.
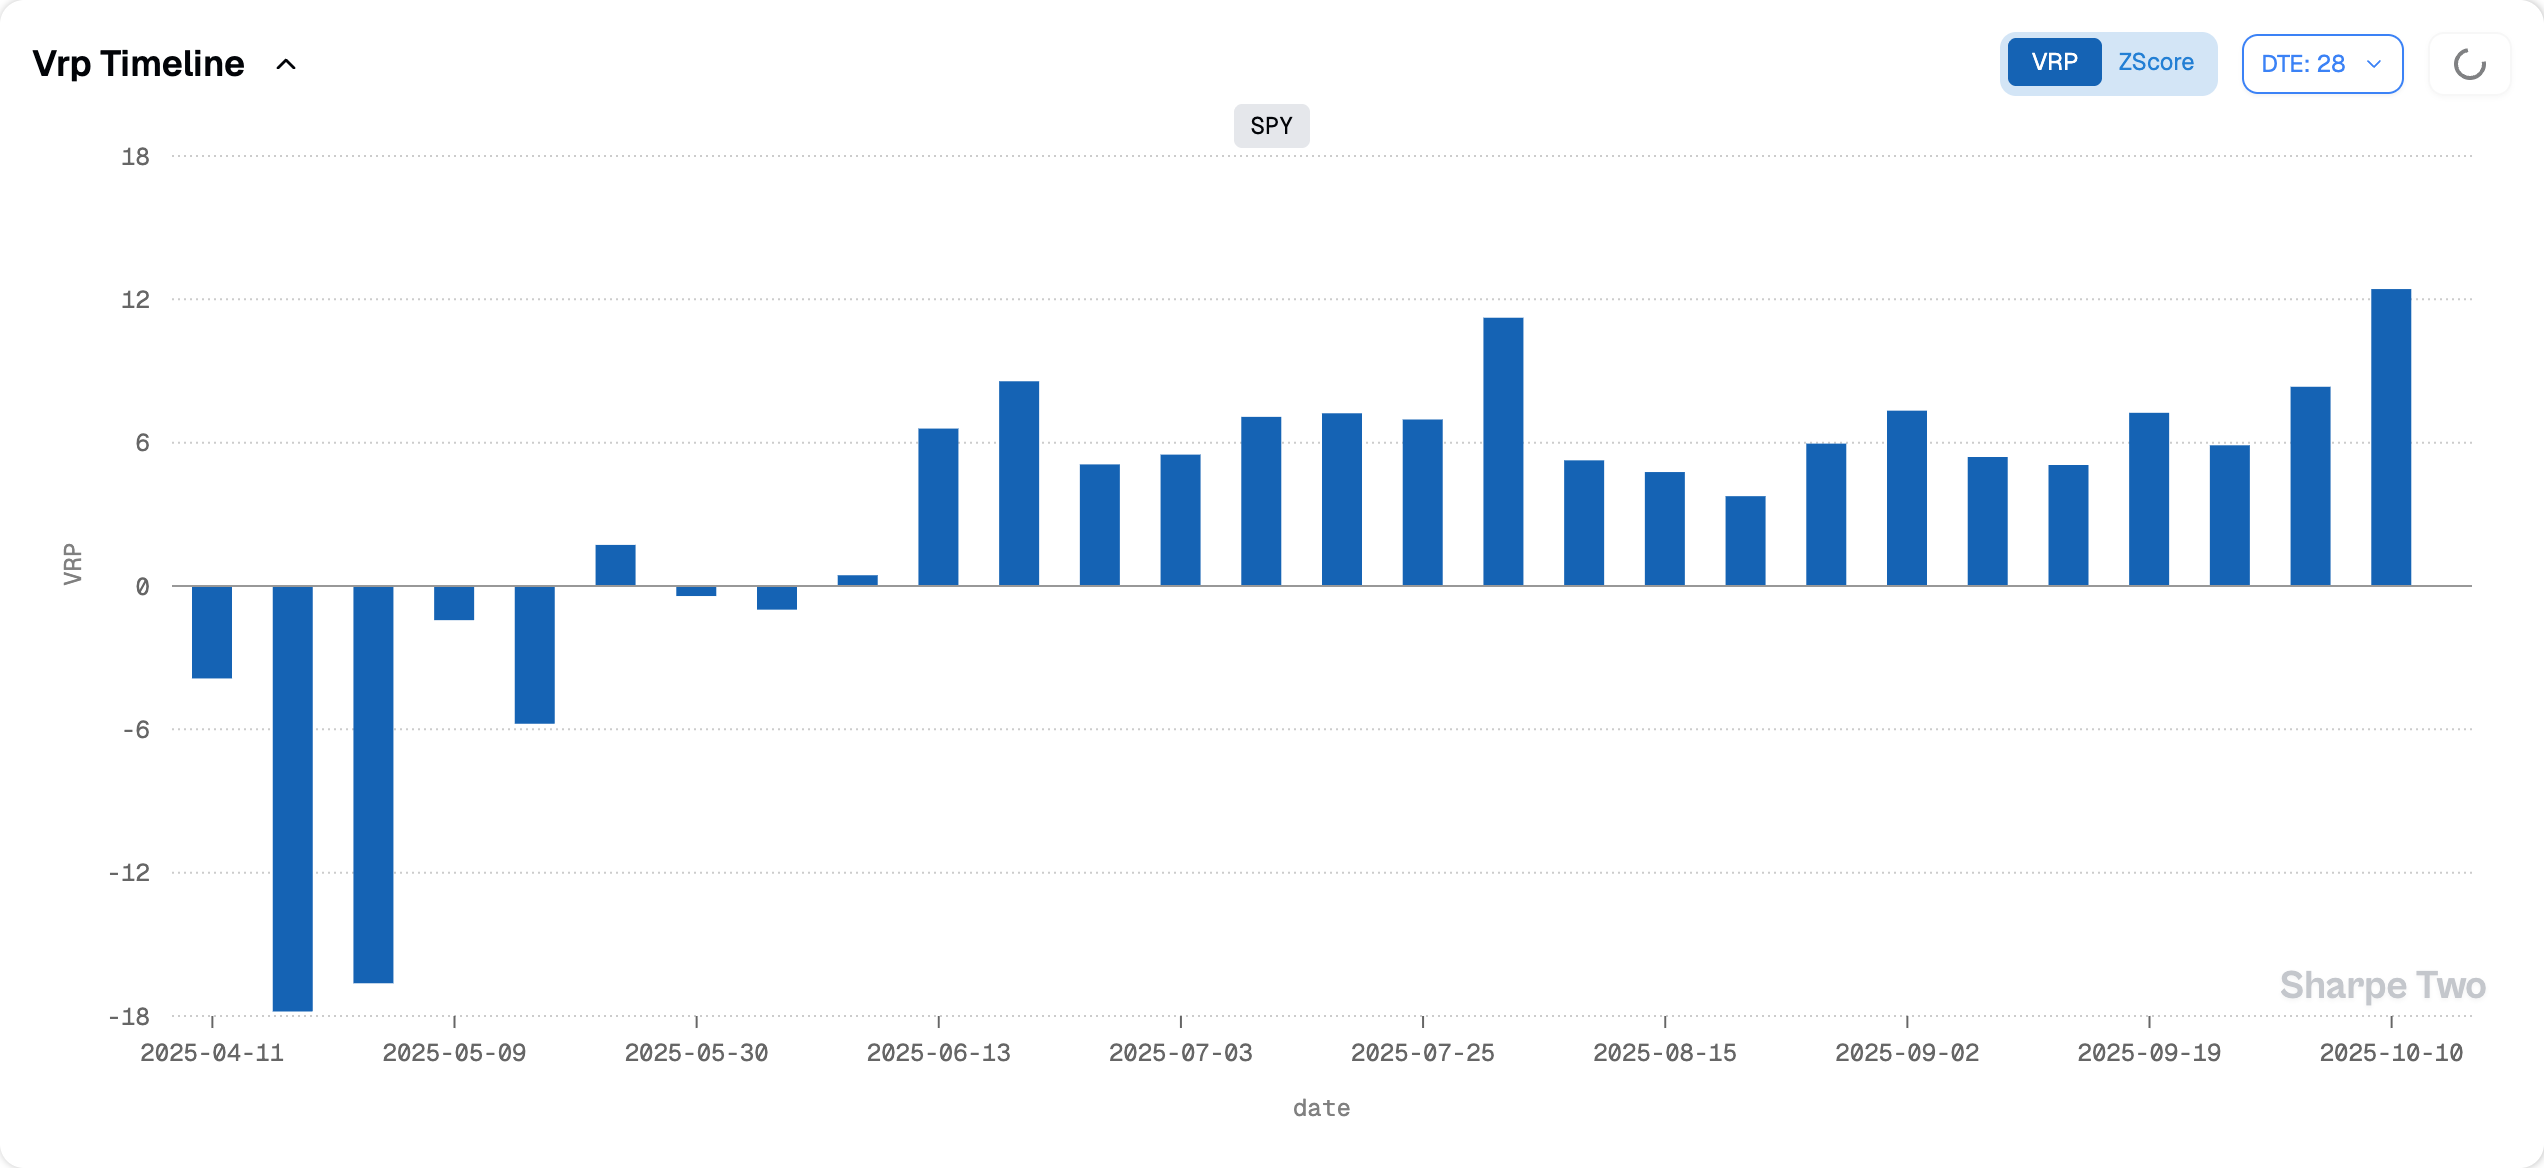
You can have the most bearish view on the market, backed by perfectly solid arguments — fine. You are still paying for insurance at an absurd price. It is like buying an iPhone for $1,200, complaining that it is expensive (perhaps rightly so), and then deciding to pay $300 a year for insurance. You may love-hate your phone and justify it however you like, and no one would blame you. But from an accounting standpoint, by the time the asset is fully depreciated and its resale value tanks, you will have effectively paid for two iPhones.
And if you are the insurance provider, what a business that is. You simply need fewer than 25% of iPhones to be claimed for full replacement each year to run a very profitable model.
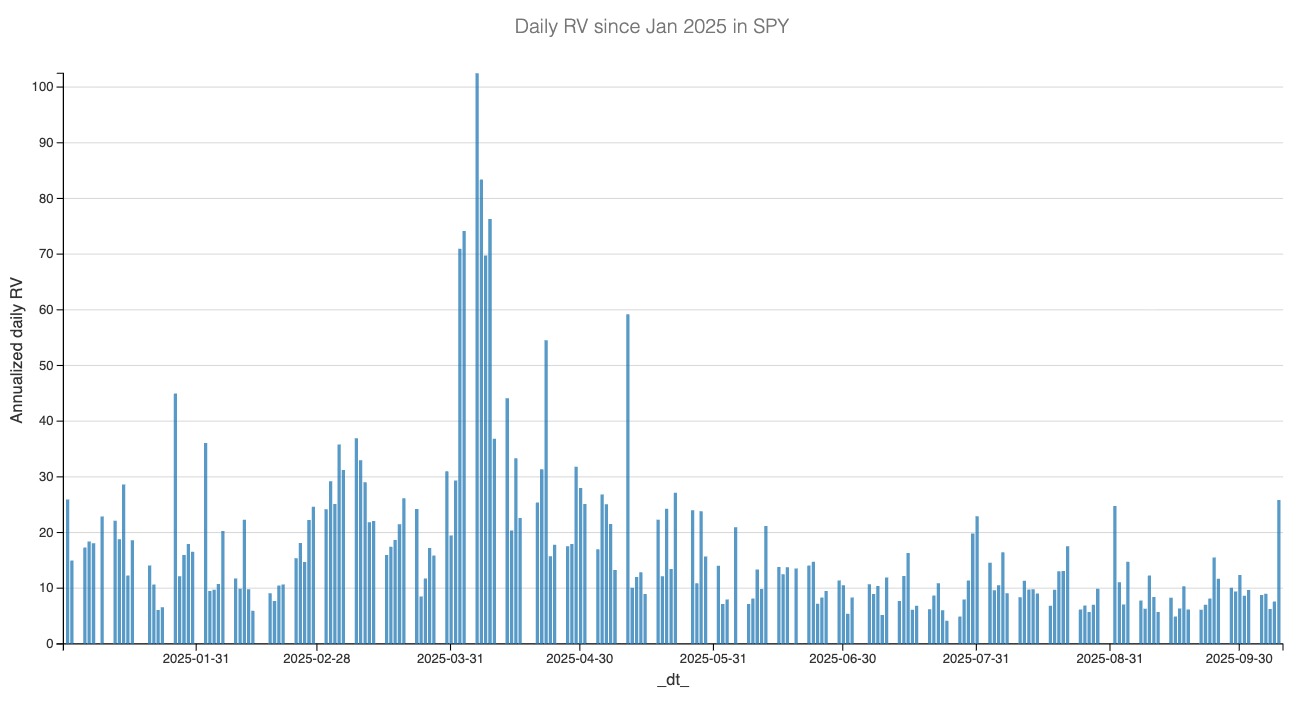
In options trading, the logic is the same. We need to gauge the level of stress in the marketplace and ask whether a VIX at 21.6 truly covers the risk. So what does our 30-day realized volatility forecast tell us?
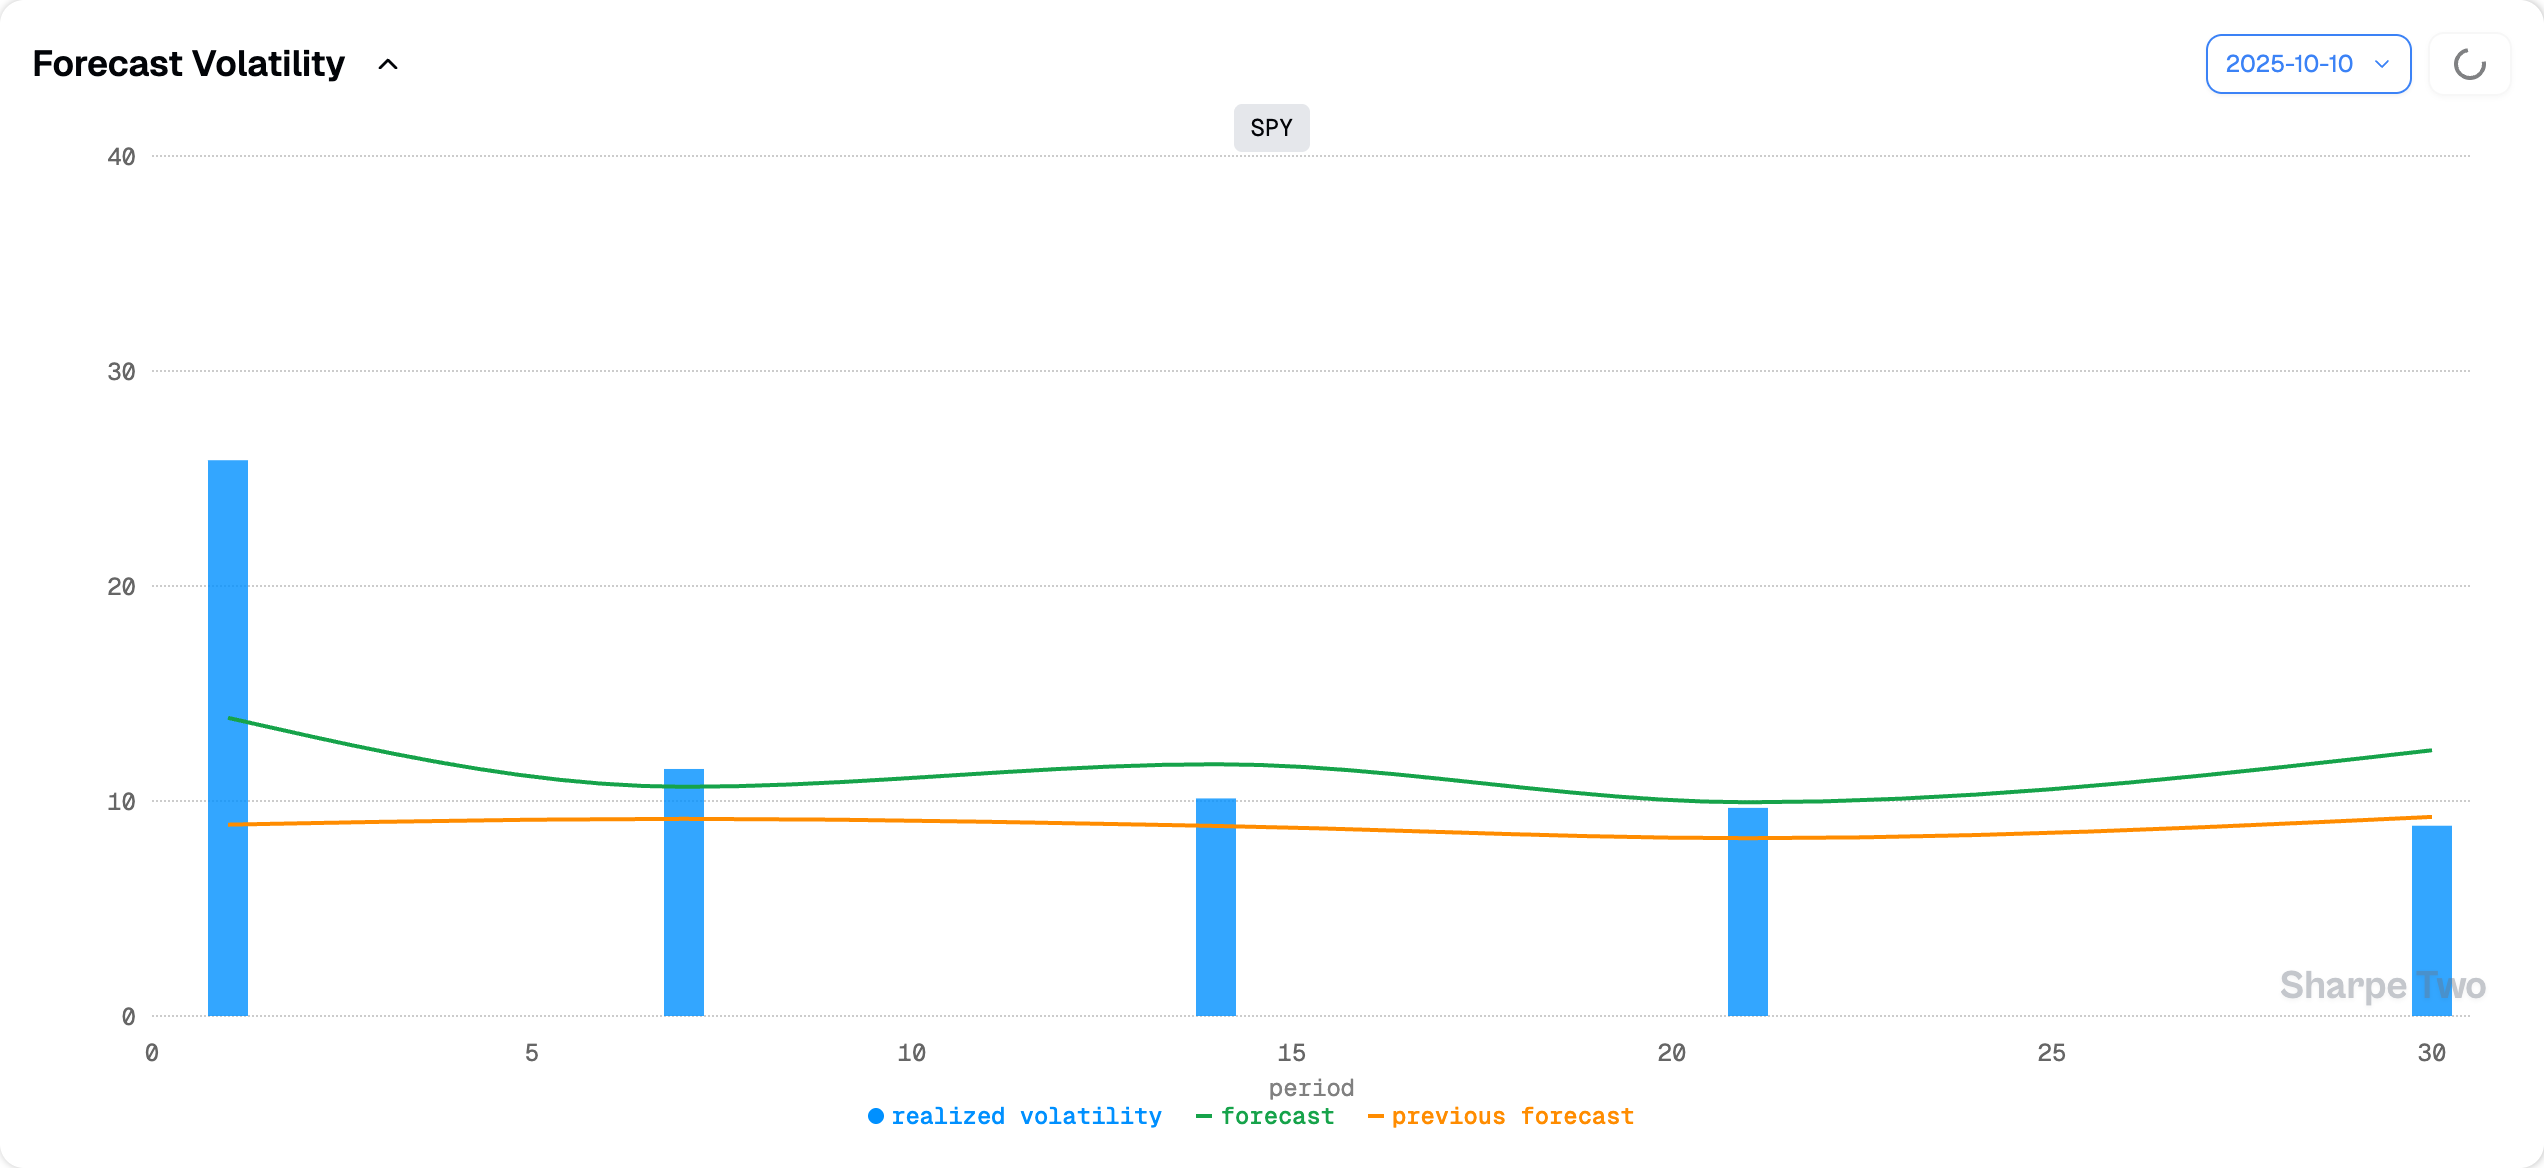
Not much has changed from last week: we are sitting around 9, with an expected move up to roughly 13 over the next 30 days. We know this model tends to lag a little and capture more of the long-term average. But let us imagine things really start to heat up — realized vol jumps from 9 to 15. That would mark a dramatic regime shift compared to the past month. For that to happen, we would need to see daily realized variance consistently running between 15 and 20 for at least two weeks straight.
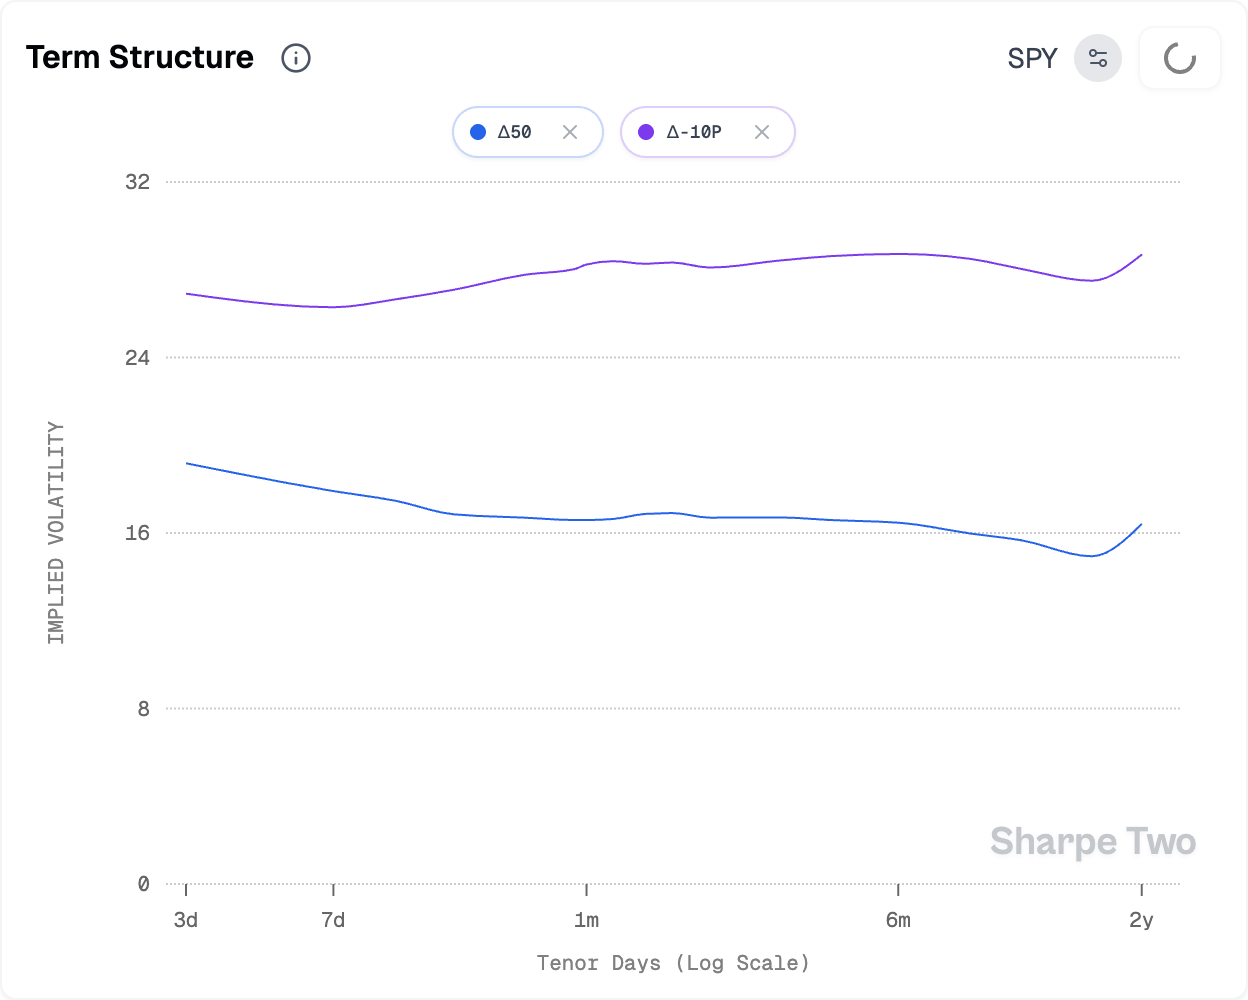
At first glance, a sustained pickup in realized volatility seems unlikely. We have had a few rough patches over the summer, but they were quickly absorbed — and VIX 6M at 22 does not suggest otherwise. Still, Friday was a reminder that we remain in a headline-driven market, and realized volatility could easily catch up as tit-for-tat headlines keep hitting the newswire. Watching how the term structure behaves over the next few weeks will be key. After Friday, it flattened noticeably, with ATM IV even showing mild backwardation.
Another signal worth monitoring closely is the volatility of implied volatility itself. With Friday’s move, vol-of-vol bounced off multi-month lows. What we do not want to see is an acceleration of vol-of-vol on the way up — that would lend more weight to the regime-shift thesis, though it would likely require a steady flow of worrying headlines over the coming days or weeks.
We insist on this: it is not our base case. In fact, our forecasts continue to show attractive short-vol opportunities around the 30-day horizon — conveniently aligned with Thanksgiving, one of the quietest weeks of the year.
We expect tensions between Trump and China to stabilize, as they have repeatedly over the past three years (remember the balloon incident?). That said, we are back in a headline-driven market for at least a few weeks, and it will be important to monitor that de-escalation actually materializes. Otherwise, that 12-point VRP may turn out to be very thin protection indeed.

In other news
In a market dominated by headlines, whoever gets the information first has a clear first-mover advantage. We will be watching closely (if anything comes of it) the probe into alleged insider trading at AMD. A more interesting case surfaced this Friday, when millions of crypto accounts reportedly blew up on the way down — yet another reminder that leverage, not direction, is usually what kills you.
But that is not the real story. The move down was not a loss for everyone. A mysterious account, opened just days earlier, happened to take a sizable short position on Bitcoin right before Trump’s salvo of threats. Impeccable timing. And being data-driven, we can only envy the “models” and feature sets that made such a trade possible — executed with such confidence, and in size, at the perfect moment.
Let us guess: some very advanced deep-learning architecture on candlestick patterns, coupled with factor analysis of the crypto ecosystem and agentic sentiment parsing across social media — all, needless to say, at scale? Are we close? Probably not. Any reasonable data scientist knows that an AUC of 1 means the model is leaking somewhere — in other words, using information from the future to make predictions. One wonders where that leak might have come from...
Thank you for staying with us until the end, and as usual, here are two interesting reads from last week:
This week’s Rebound Capital report is a masterclass in how narratives swing faster than fundamentals. Alphabet went from “AI will kill Google” to “still undervalued at all-time highs” in less than a year. These emotional extremes are the rule, not the exception. Forty percent of top U.S. companies go through 50% drawdowns every decade—yet most recover stronger. A smart reminder that conviction and timing often matter more than headlines.
Both stock traits (the “factor zoo”) and behavioral quirks (the “bias zoo”) shape retail performance—but which matters more? Using machine learning on 15 million investor accounts in India, the study finds neural networks can predict winners and losers. Interesting read for self analysis and being aware of our own trading limitations.
That is it for us this week, we wish you an excellent week ahead and as usual, happy trading.
Ksander