
Forward Note - 2025/06/29
VIX6M and chill
Equities go up and to the right — whatever you throw at them. Sure, they may have the occasional bloody period, but take a bit of distance and today’s price will almost always look cheap six months down the line. This semester was no exception.
It is too early to form a well-rounded assessment of Trump’s policies, but we can already measure their impact on the stock market. The obvious: after six months, equities are still climbing that familiar slope. Yes, they went through hell — we endured the worst bout of volatility seen over a semester in a long time. But since then, the market has calmed, and the anticipation of volatility over the next six months has dropped sharply.

We often talk about the VIX — that familiar gauge of expected realized volatility over the next 30 days. A little less known is VIX6M, which tracks expectations over, well, six months. Options and volatility theory tell us that VIX6M should sit above VIX when the market has “normal” risk expectations — your classic contango. That is definitely the case right now.

In our Signal du Jour this week, we noted that the contango was so pronounced it could even invert in the coming days or weeks — a reason to be cautious when selling cheap gamma. But what about the longer term? What is VIX6M telling us?
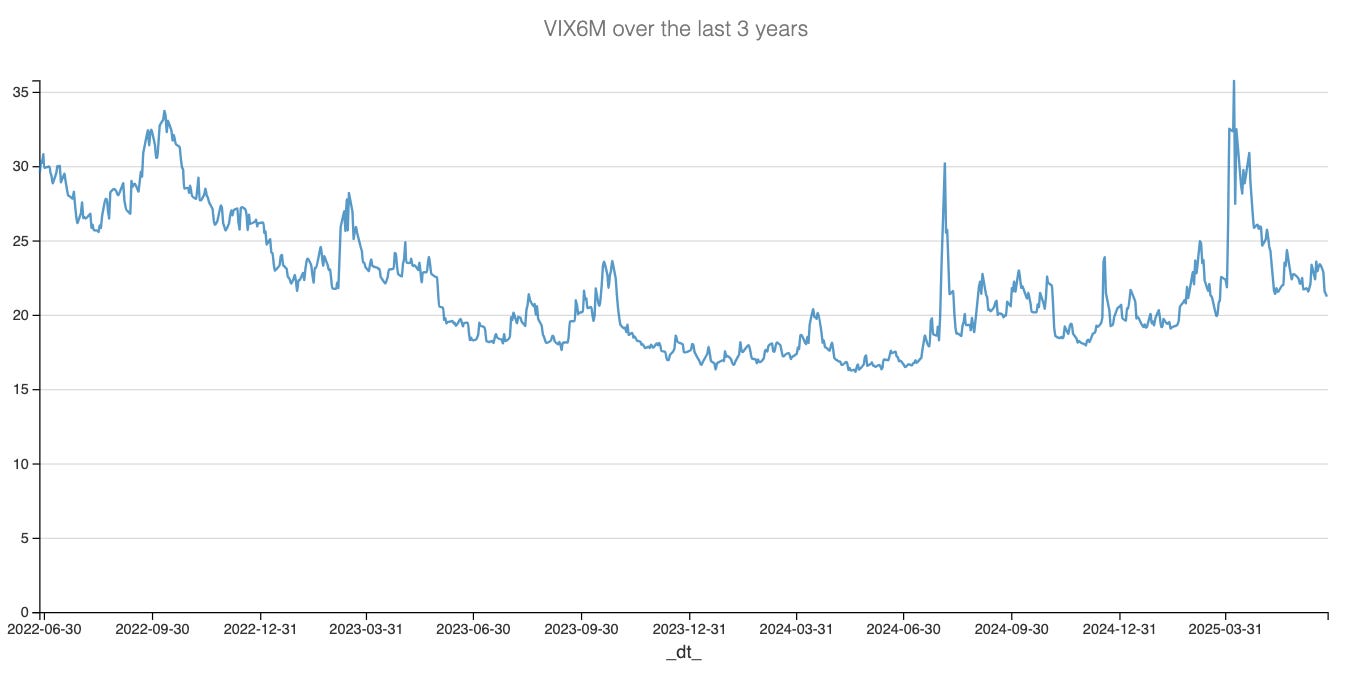
Without over-reading it, one glance at that chart says it all: we are bang in the middle of the range observed over the past three years. Nothing much to add. And that, really, is the point.
Right now, open social media and you will see two camps at it. On one side: those convinced macro conditions are so bad that a (major) equity correction is just around the corner. On the other: those flashing their diamond hands after holding firm in March and April and buying the dip when the world seemed to end.
Both groups are amusing — because you cannot really verify the story of either. The first is, by definition, subjective. The other… well.
But VIX6M sitting in perfectly neutral territory tells you something important. The market expects much more risk ahead than it did a year ago, when VIX6M was snoring at 17. Yet it also tells you that today’s uncertainty is nothing like summer 2022, when inflation was still hot and the Fed was hiking at full speed.
If we had to wrap this note here, the message would be simple: chill. Enjoy the summer. Spend a little less time glued to the market (or social media). Things are not about to burn to the ground. But do not be naive either — the likelihood of a 1% down move is much higher than it was a year ago. So maybe chill… on the leverage too.
Let us run a basic risk management check. With VIX6M around 22, we can estimate how often the market is expected to drop by more than 1% over the next six months:
22% annualized vol → ~1.39% daily vol
A -1% move is about 0.72 standard deviations below zero
Probability of below -0.72σ ≈ 24%
Since we want specifically downward moves → ~12% of days
126 trading days × 12% ≈ 15 days
So, about 15 days where a 1% drop should not surprise anyone.
Of course, these expectations will reprice as new information comes in. But right now — knowing the tariffs, the state of the economy, the debt load, the Trump unpredictability factor, and the constant geopolitical back-and-forth — the market is only pricing around 15 days over the next six months with a moderate drawdown. (And 1% is really nothing.)
You could argue that number is low. But thanks to the beauty of options and realized volatility, it is best to see it the other way around: it is more likely the market’s current expectations are overestimating that count. Not by much — but enough that our back-of-the-newsletter math points to something like two bad days a month over the next six months. Put it like this, we are far from doomsday central.
These approximations matter. First, they help you stay grounded when those moves actually happen. And when they do, if all else is equal, a 1% drawdown starts to look like a decent opportunity to sell vol or get long.
What do we mean by all else being equal? That VIX6M does not shift enough to materially change the odds we just ran through.
But why focus on VIX6M when all the action is in the short term, when the VIX is “broken,” and when everyone says we should be watching VIX9D instead?
Simple: these indicators are just tools, and they serve different purposes. VIX9D is great at telling you what to expect over the next — well, you guessed it — nine days.

What is clear with VIX9D is that it is far more volatile than VIX6M. And that makes sense — it has to react to the constant stream of information the market is trying to digest.
If your goal — at the end of arguably one of the wildest semesters of the past decade — is to get a feel for the next six months, leaning on VIX9D is like scrolling your Twitter feed and hitting refresh on every new notification to predict the future. It does not work. It is too noisy. In fact, you could argue it hurts your trading.
And while we are at it, a VIX9D around 13 means the market expects about one day above 1% over the next nine days. If you are short because “We have to — it has gone up too much” or “The big whale will take some profit” — can your account handle more pain? For instance, if Monday brings another turn-of-the-month flow that propels everything into a gigantic firework of panic buying and margin calls?
If there is one thing to carry with you over the next six months, it is this: leverage destroys accounts, and time smooths everything out. So VIX6M — and chill.

In other news
The attacks on Jay Powell started again this week as the race for his succession is now officially open. President Trump announced that he would pick a Fed Chair who would “only cut rates.” That might make readers smile — what if inflation is on the rise, as we learned last week with the latest CPI reading? Modern economics would suggest that cutting in that context would not be the wisest move.
Yet there is a reasonable case to be made that, with oil prices roughly back in check and tariff negotiations — while slow — moving in the right direction, the effects of Trumpenomics may end up being mild.
And if we really wanted to play devil’s advocate, why risk drawing market attention to the “slightly” concerning problem estimated at 37 trillion dollars? After all, lowering rates would mechanically reduce the cost of financing and refinancing — useful, given the packed issuance calendar over the next six months.
While we certainly do not expect a rate cut in July, the outcome of that meeting will be critical to gauge whether Powell is still at the helm — or if the lords fighting for his succession have already started to take over.
Thank you for staying with us until the end and as usual, here are two great reads:
It is no surprise to our readership that Sharpe Two relies on an intensive data stack to come up with all our analytics. Here is a great article making a review of the classic book “Design data intensive application” that we read a few years ago.
A beautifully written journey down Canada’s wild Bloodvein River — part adventure, part reflection on what it means to disconnect. If the market’s flow is wearing you out, let this piece reset your perspective.
That is it for us, we wish you a wonderful (4th of July) week ahead and as usual, happy trading.
Ksander
Data, charts, and analysis are powered by Thetadata and Dataiku DSS.
Contact at info@sharpetwo.com.
Disclaimer: The information provided is solely informational and should not be considered financial advice. Before selling straddles, be aware that you risk the total loss of your investment. Our services might not be appropriate for every investor. We strongly recommend consulting with an independent financial advisor if you're uncertain about an investment's suitability.