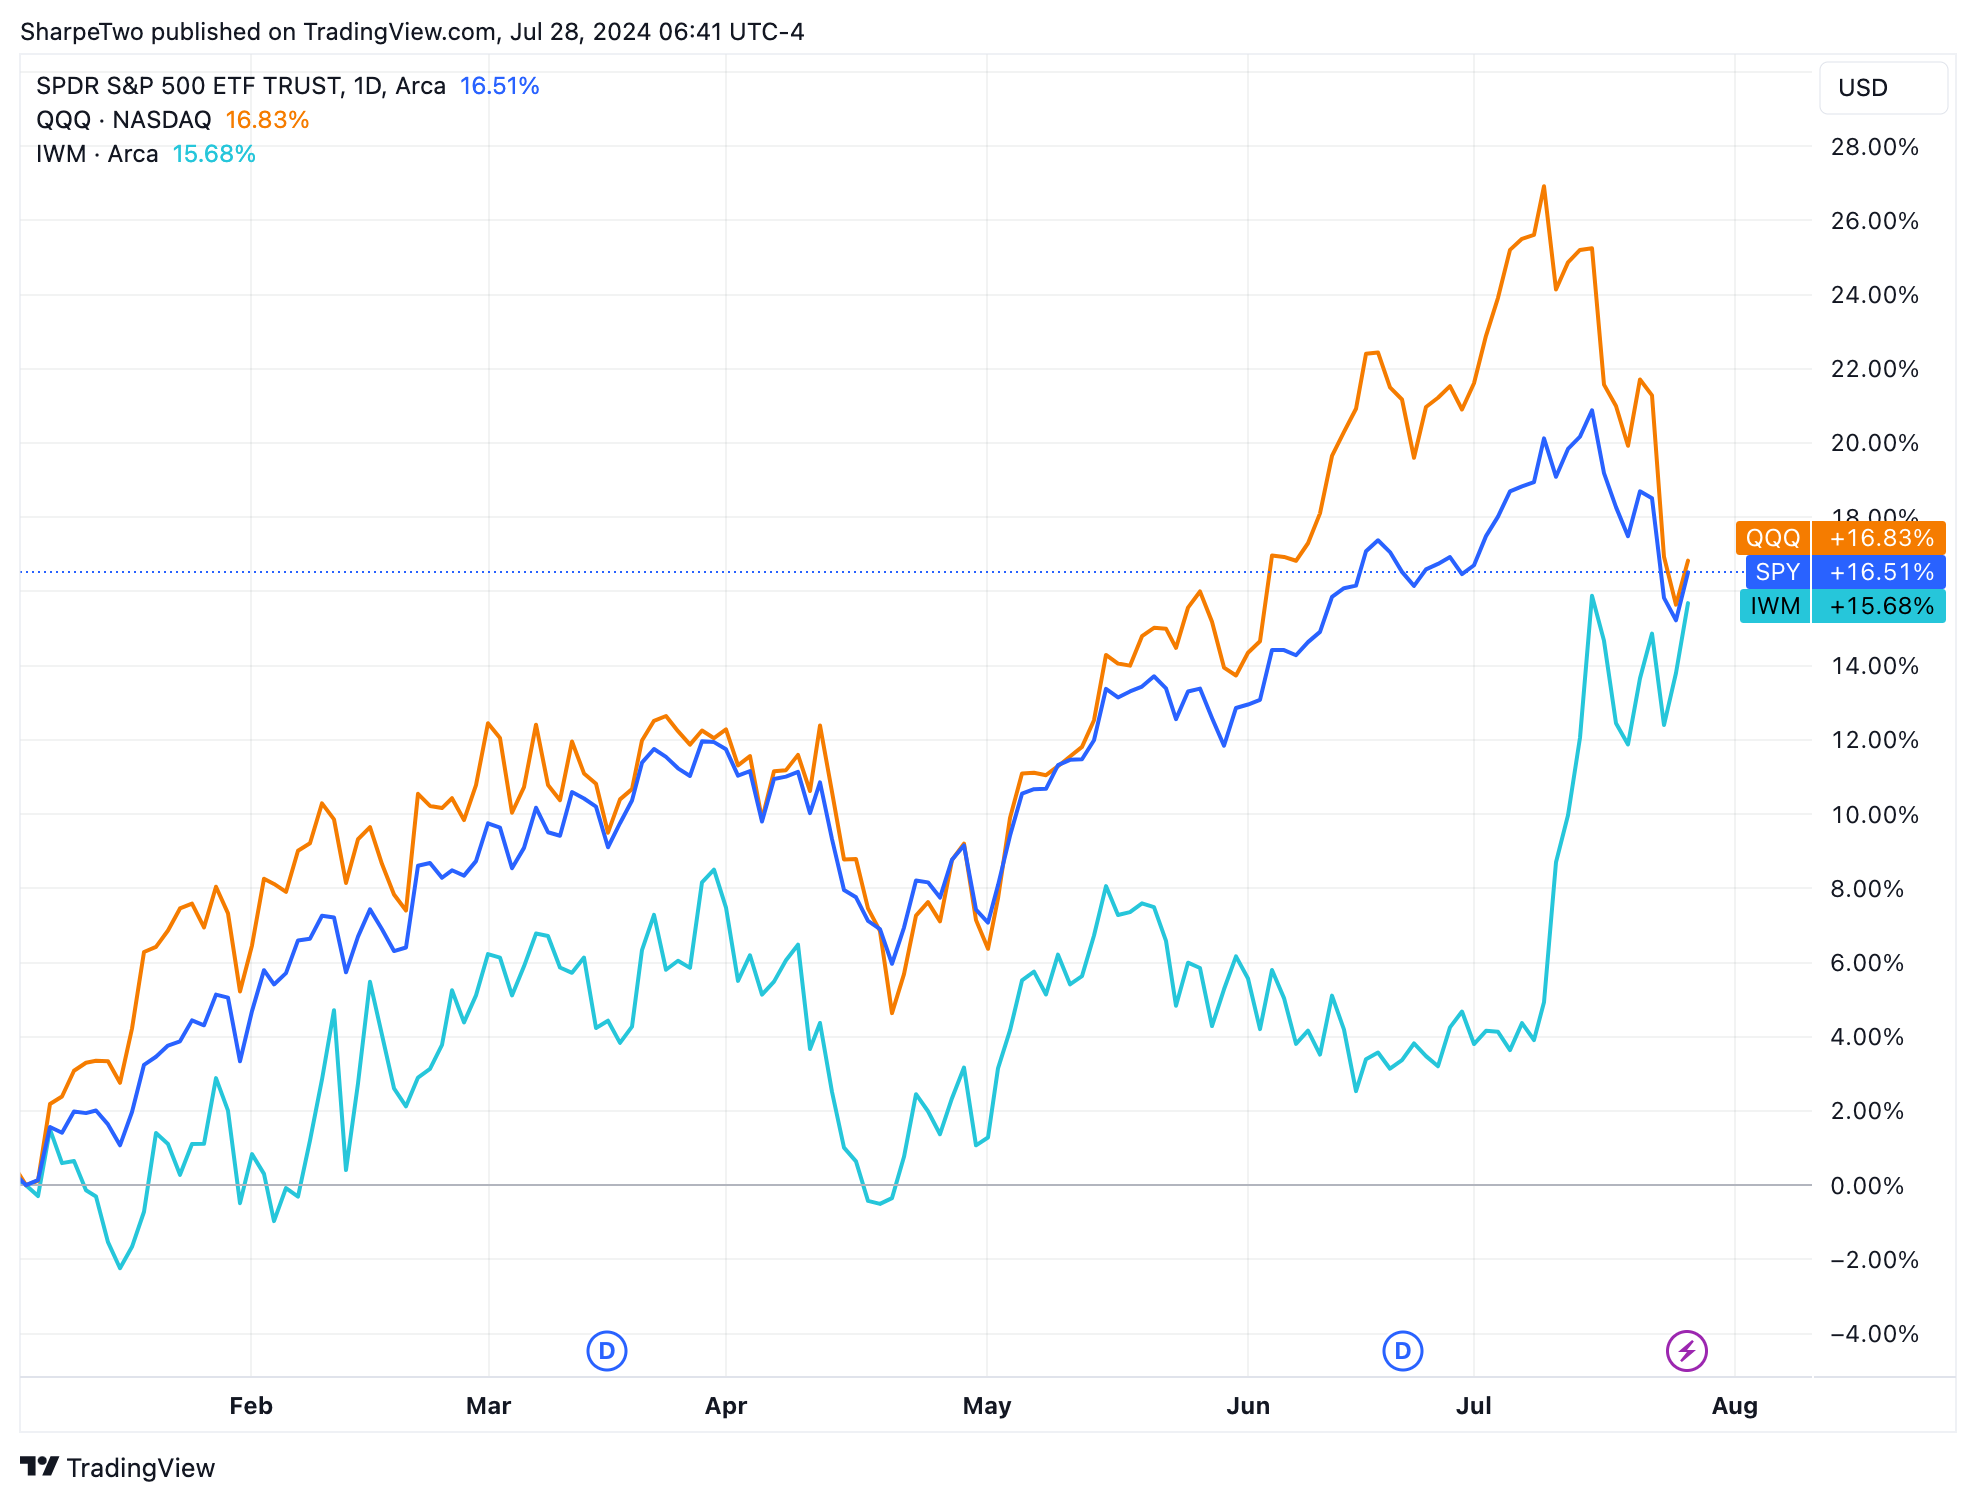
You have two ways of looking at what happened in the market this week: small and mid-caps finished up 3.65% (IWM), while the Nasdaq lost 2.65% (QQQ). Similarly, the VIX closed above 16 for the second week, yet far from the highest readings observed on Thursday afternoon when it flirted with 20.
Is the glass half empty or half full? Which will you choose: the red pill or the blue pill?
If you are in the red pill camp, you've decided that this is it: the market has finally awakened from the AI farce, and technological stocks can no longer hide the nonsense. To fuel this argument, you will point to the latest earnings from Tesla. Despite the announcement of Robotaxi starting in early October, the stock was punished by 12% when it revealed that growth was significantly lower than anticipated.
Even Google, despite beating estimates, couldn’t avoid a decline of about 4%. Following this rhetoric, your eyes are locked on Microsoft and Amazon, which are set to report next week. However, the big prize is Nvidia, which will report later this month.
It’s only an accident that we didn’t see more selling on Friday despite the higher-than-anticipated inflation figure. Certainly, you expect the selling pressure to return first thing Monday morning.
We concede that point. Last week already saw the highest measured realized volatility over seven days:
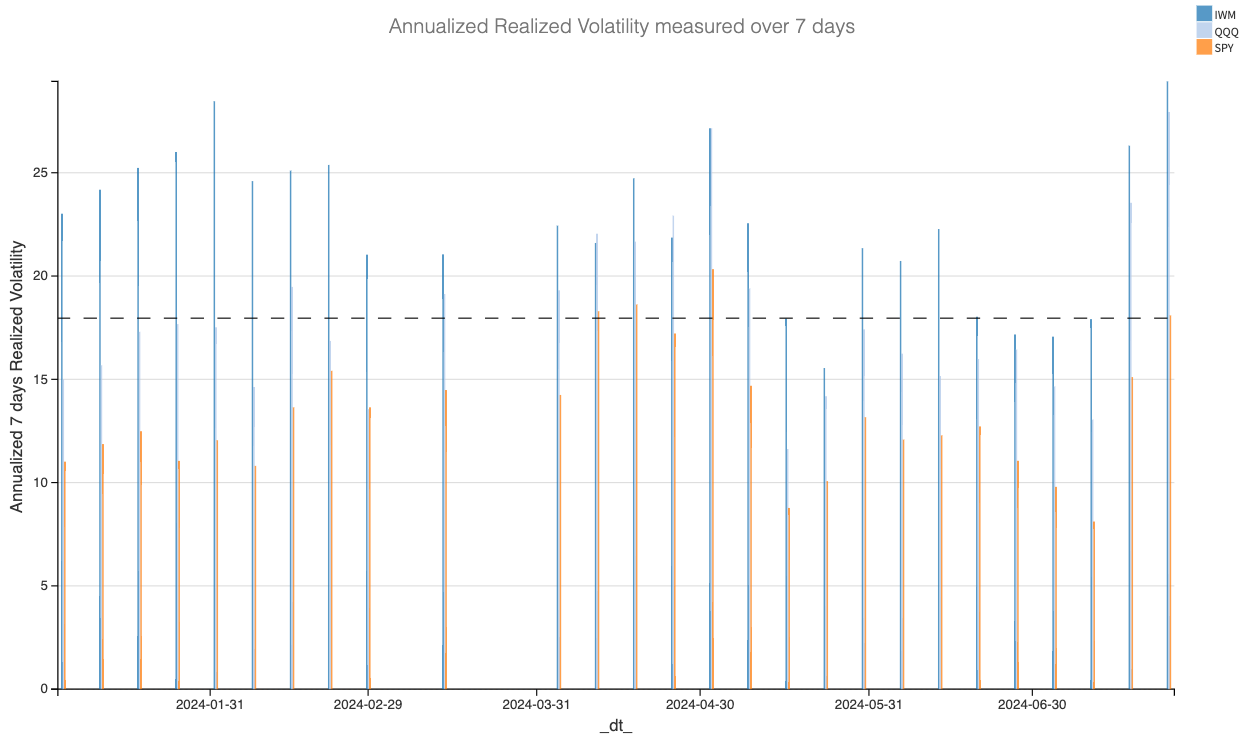
Considering the dense calendar ahead, realized volatility is unlikely to drop significantly. In addition to the big earnings mentioned above, we also have an FOMC meeting and the employment report on Friday.
Yet, is this enough to stop viewing the glass as half full?
First of all, the indices are still up a staggering 16% - what is there to complain about?
Sure, we are almost down 10% from the highs, and this would qualify as a bear market. We would call it a normal move-down when volatility picks up. Let’s look at the data:
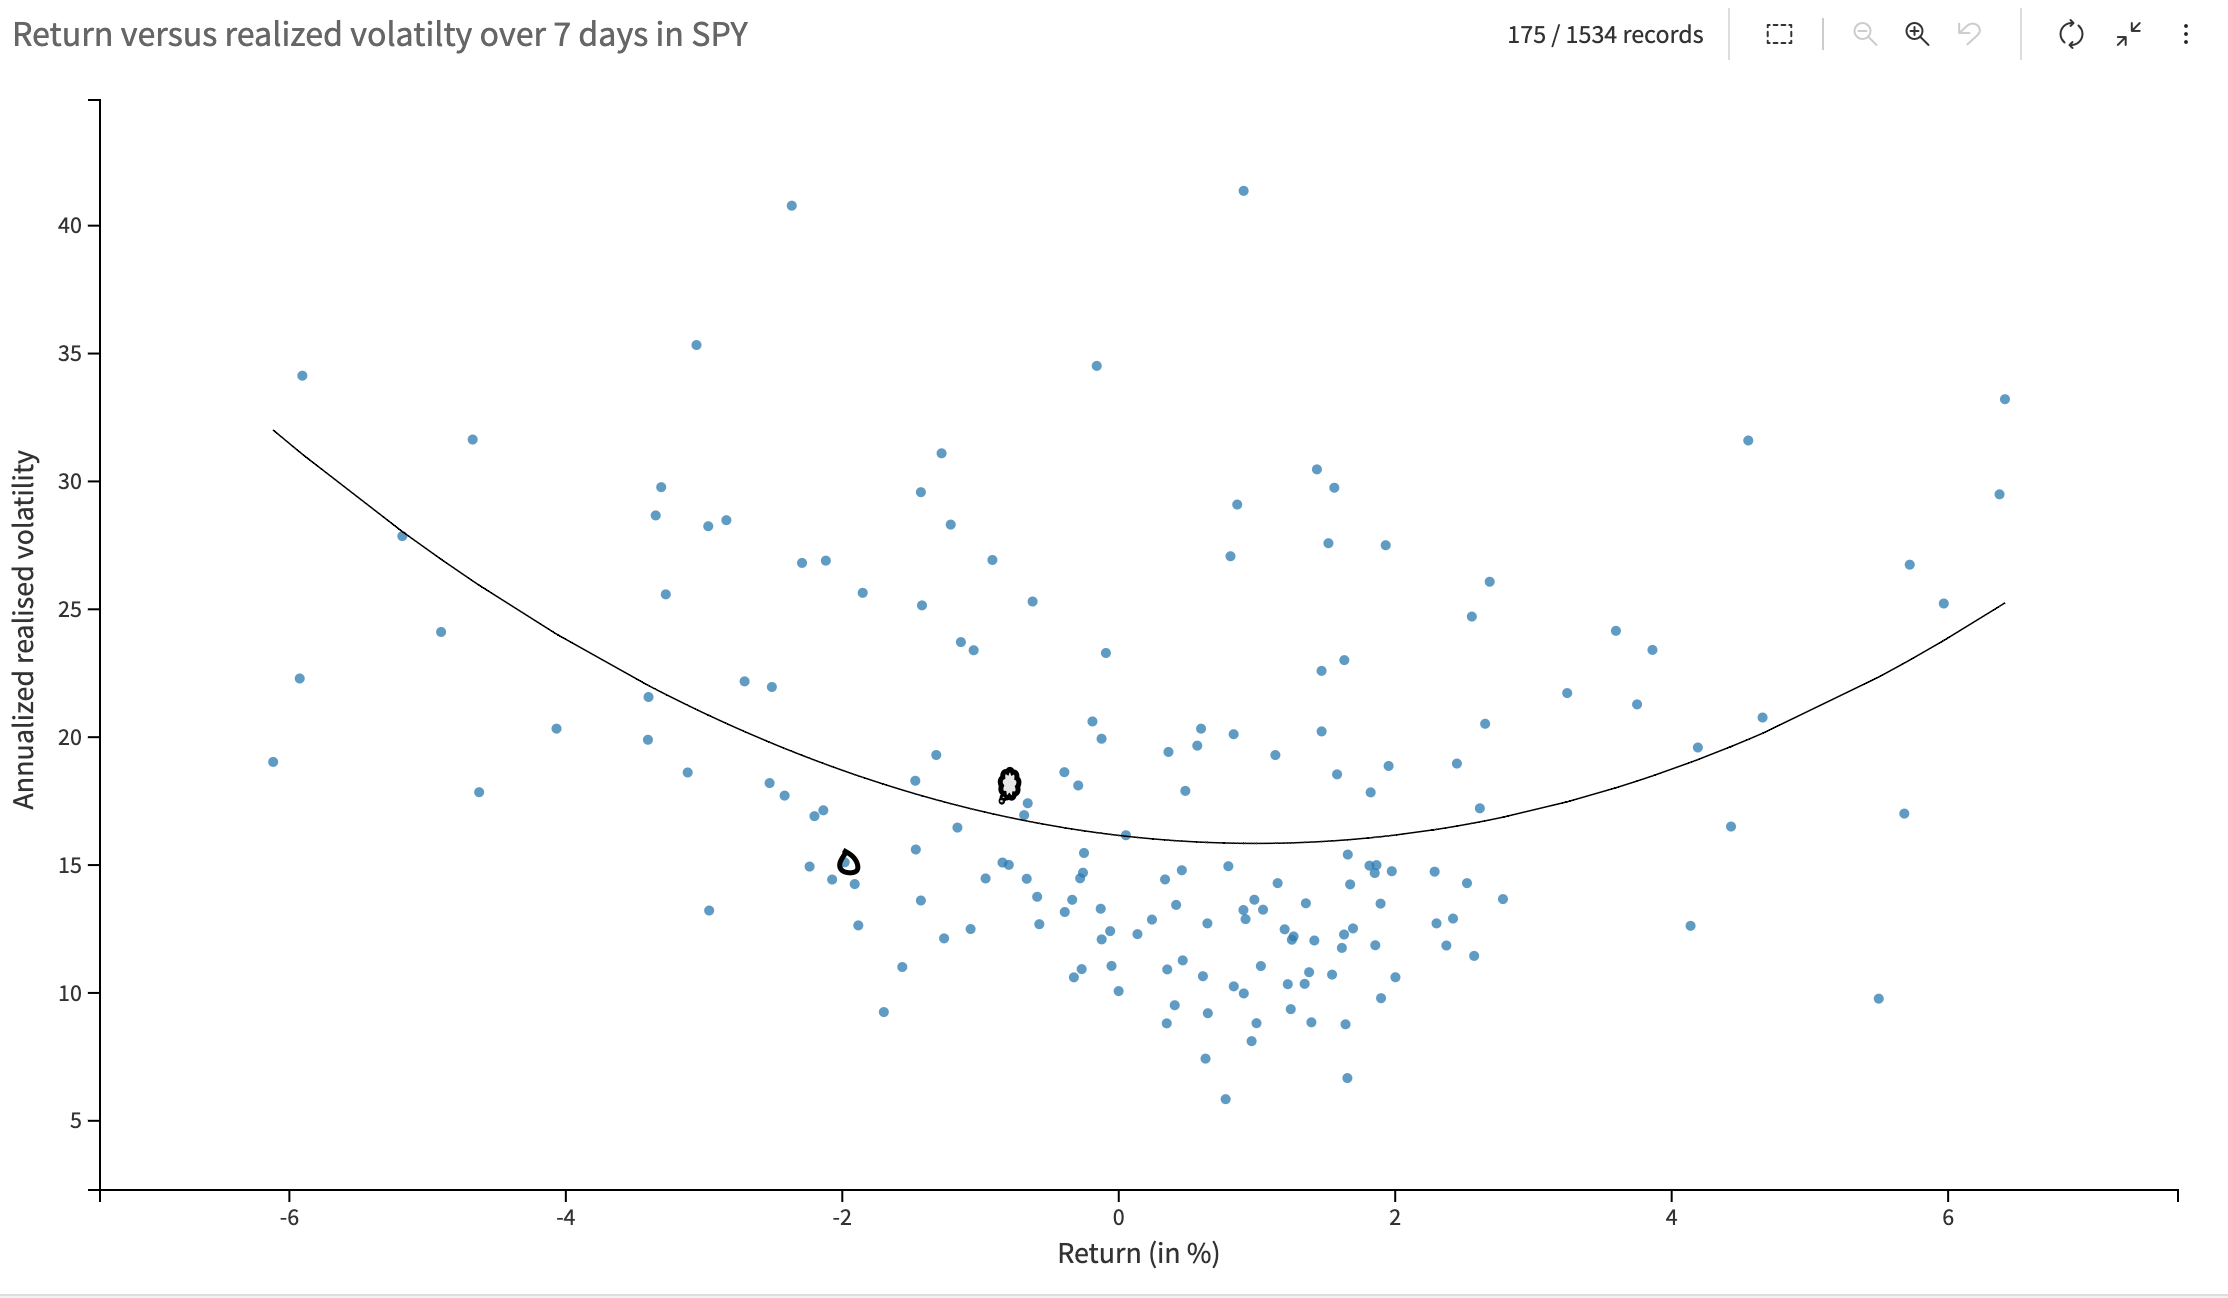
Here is a chart showing the realized volatility over seven days versus the returns in the SPY since 2020. The general idea is that volatility tends to rise when you see abnormal movement in the index, which is normally more pronounced on the downside. Do you see two little black dots close to the (questionable) polynomial fit? The one above was the point for this week where we realized 18 and lost about 1%. The other one was from last week.
The least we can say is that despite the “feeling of excitement” these last two weeks brought after months of lethargic trading, these days have nothing to do compared to the real outliers when the market is panicking.
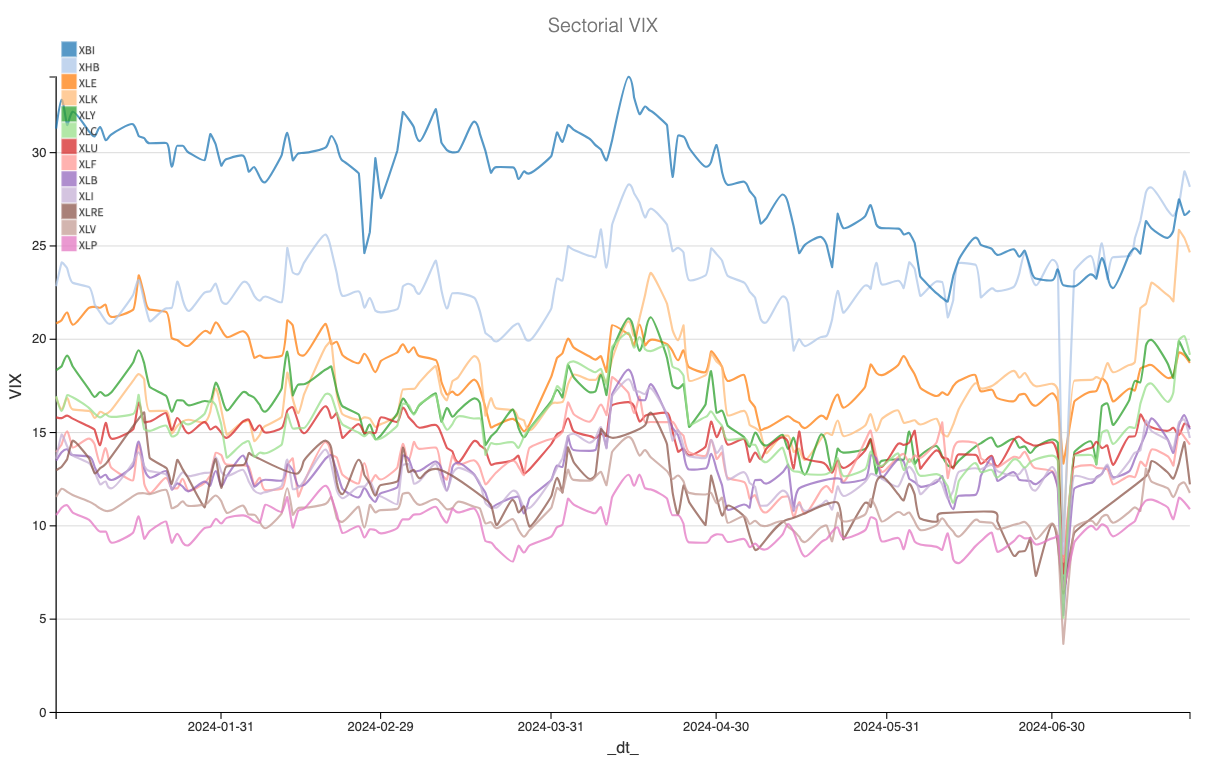
We don’t mean to imply that nothing will happen. As usual, we’d rather put emotion aside and stay data-driven. Here is a chart that shows the evolution of implied volatility for the different sectors in the SP500.
Here is a chart showing the realized volatility over seven days versus the returns in the SPY since 2020. The general idea is that volatility tends to rise when there are abnormal movements in the index, which are typically more pronounced on the downside. Notice the two little black dots close to the (questionable) polynomial fit? The one above was the point for this week where we realized 18 and lost about 1%. The other one was from last week.
The least we can say is that despite the “feeling of excitement” these last two weeks brought after months of lethargic trading, these days have nothing to do with the real outliers when the market is panicking.
We don’t mean to imply that nothing will happen. As usual, we’d rather put emotion aside and stay data-driven. Here is a chart that shows the evolution of implied volatility for the different sectors in the SP500.
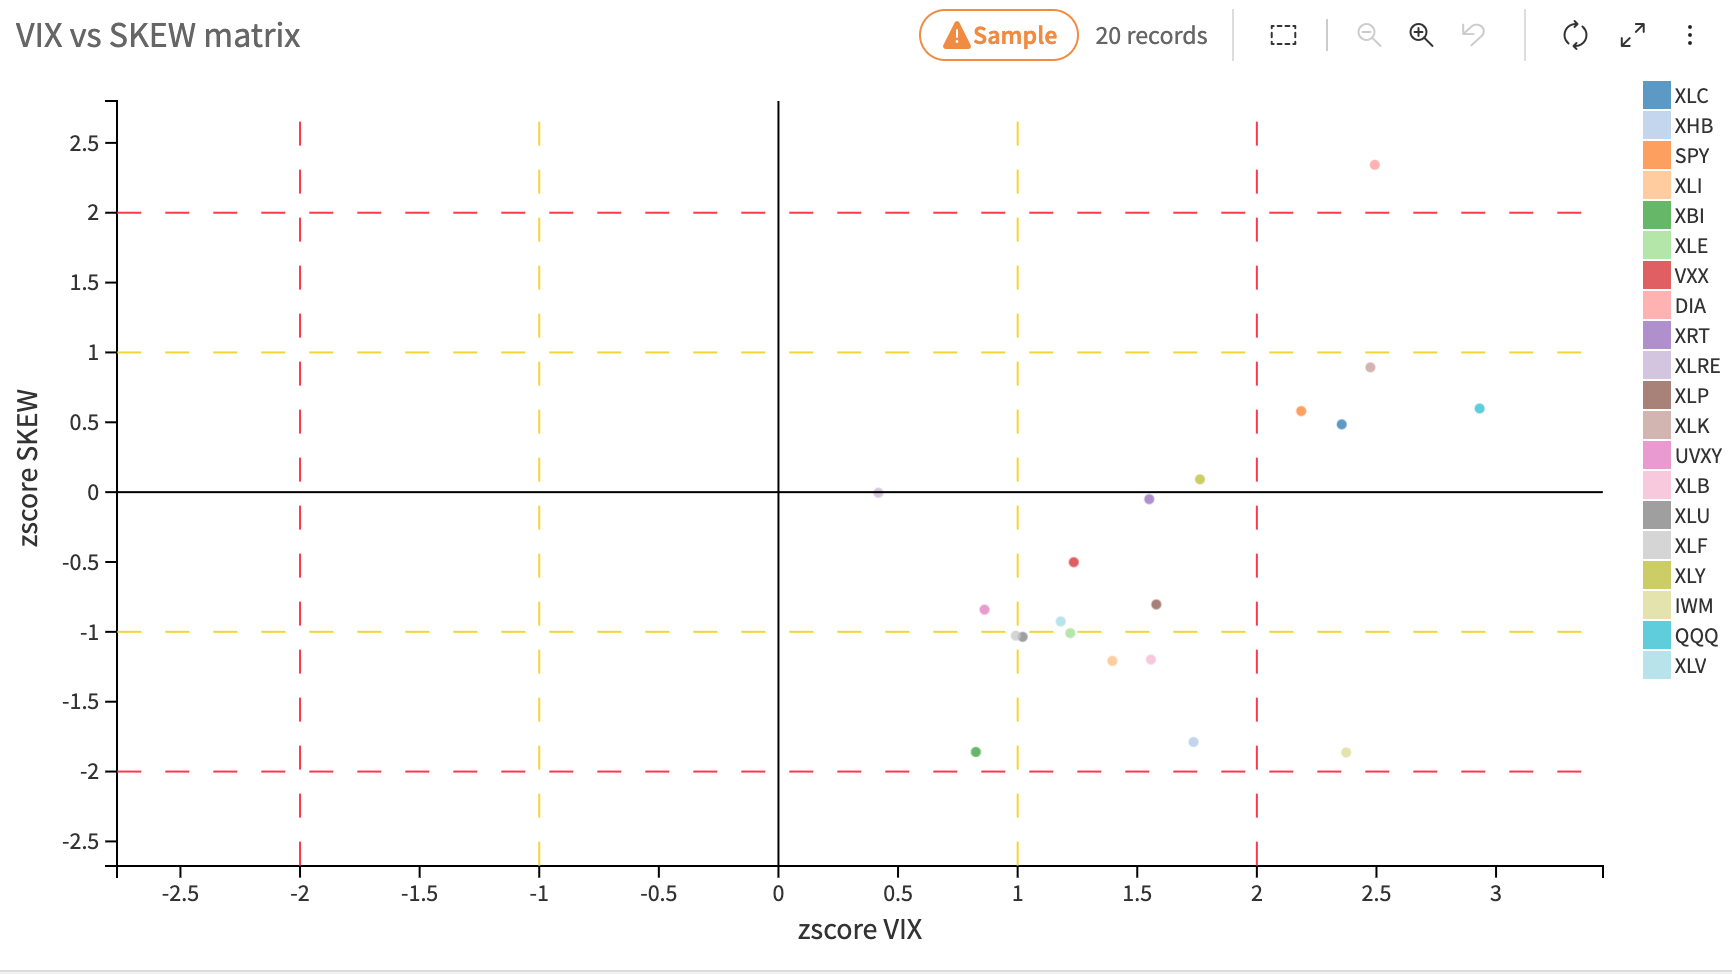
This time, we add the skew to the picture and look for abnormal puts buying versus calls. The only ones in the quadrant with high volatility and a slightly more tilted skew than usual are XLK, XLC, QQQ, and SPY. Oh, and right there at the top with a tilted skew? DIA, influenced by the weight of MSFT and AMZN, which are due to report this week.
The advantage of these measures is that they are forward-looking—they are not a perfect indication of what will happen. Still, they could be interpreted as such: people have been dabbling in options in these sectors more than usual recently. Unless a real justification for the current sentiment emerges, things may revert to normal.
Let’s see if the next few weeks bring us the red pill, then.

Sharpe Two is a reader-supported publication. To receive new posts and support our work, consider becoming a free or paid subscriber.
In other news
Still supporting the half-full glass, the US GDP grew at a 2.8% annualized rate in Q2, suggesting the economy is more resilient than anticipated despite some early signs of cooling. This rebound almost came as a surprise after the drop to 1.4% in Q1. Many companies are issuing warnings and lower guidance about the upcoming quarters.
Does this change the rate cut trajectory for 2024 and early 2025? The market is now banking on two cuts instead of three, following slightly higher inflation numbers on Friday. However, this doesn't challenge the view that September will see the first-rate cut right before the election.
Thank you for staying with us until the end. As usual, here are a few interesting reads from last week:
- Donald Trump is banking on cryptocurrency to boost his campaign even further. He pledges that the US should build a national stockpile of Bitcoin. provides an excellent summary of everything you need to know.
- Behavioral economics, particularly through prospect theory, offers crucial insights into human biases that affect decision-making in trading and investing. There are still five months of trading before the end of 2024, so reframing your mindset with is not too late.
That's it for us; we wish you a wonderful FOMC week ahead and happy trading.
Ksander
Data, charts, and analysis are powered by Thetadata and Dataiku DSS.
Have access to our indicators using our API.
Book a consultancy call to talk about the market with us.
Contact at info@sharpetwo.com.
Disclaimer: The information provided is solely informational and should not be considered financial advice. Before selling straddles, be aware that you risk the total loss of your investment. Our services might not be appropriate for every investor. We strongly recommend consulting with an independent financial advisor if you're uncertain about an investment's suitability.