We asked you to call us whenever the VIX rose above 16 again. Well, thank you for interrupting our holidays. We certainly didn’t expect to see a VVIX reading above 90 in the middle of July. But after all, who can really predict when volatility will spike?
The big question: Is this just a spike, and will we be back to 12 before the end of the summer, or are we (finally) changing the paradigm? Our current favorite view is the latter.
Over the past six months, the narrative has been straightforward: inflation is sticky, but it should come down at some point, triggering some rate cuts, while the economy is much more resilient than anticipated. Oh, and obviously, there's an election at the turn of the year. With that in mind, let’s buy and coast for a few months.
Well, a few months have passed, and here we are: inflation has cooled down, the rate cut for September is almost guaranteed, and it looks like we already have a winner for the next election. So, what happens next?
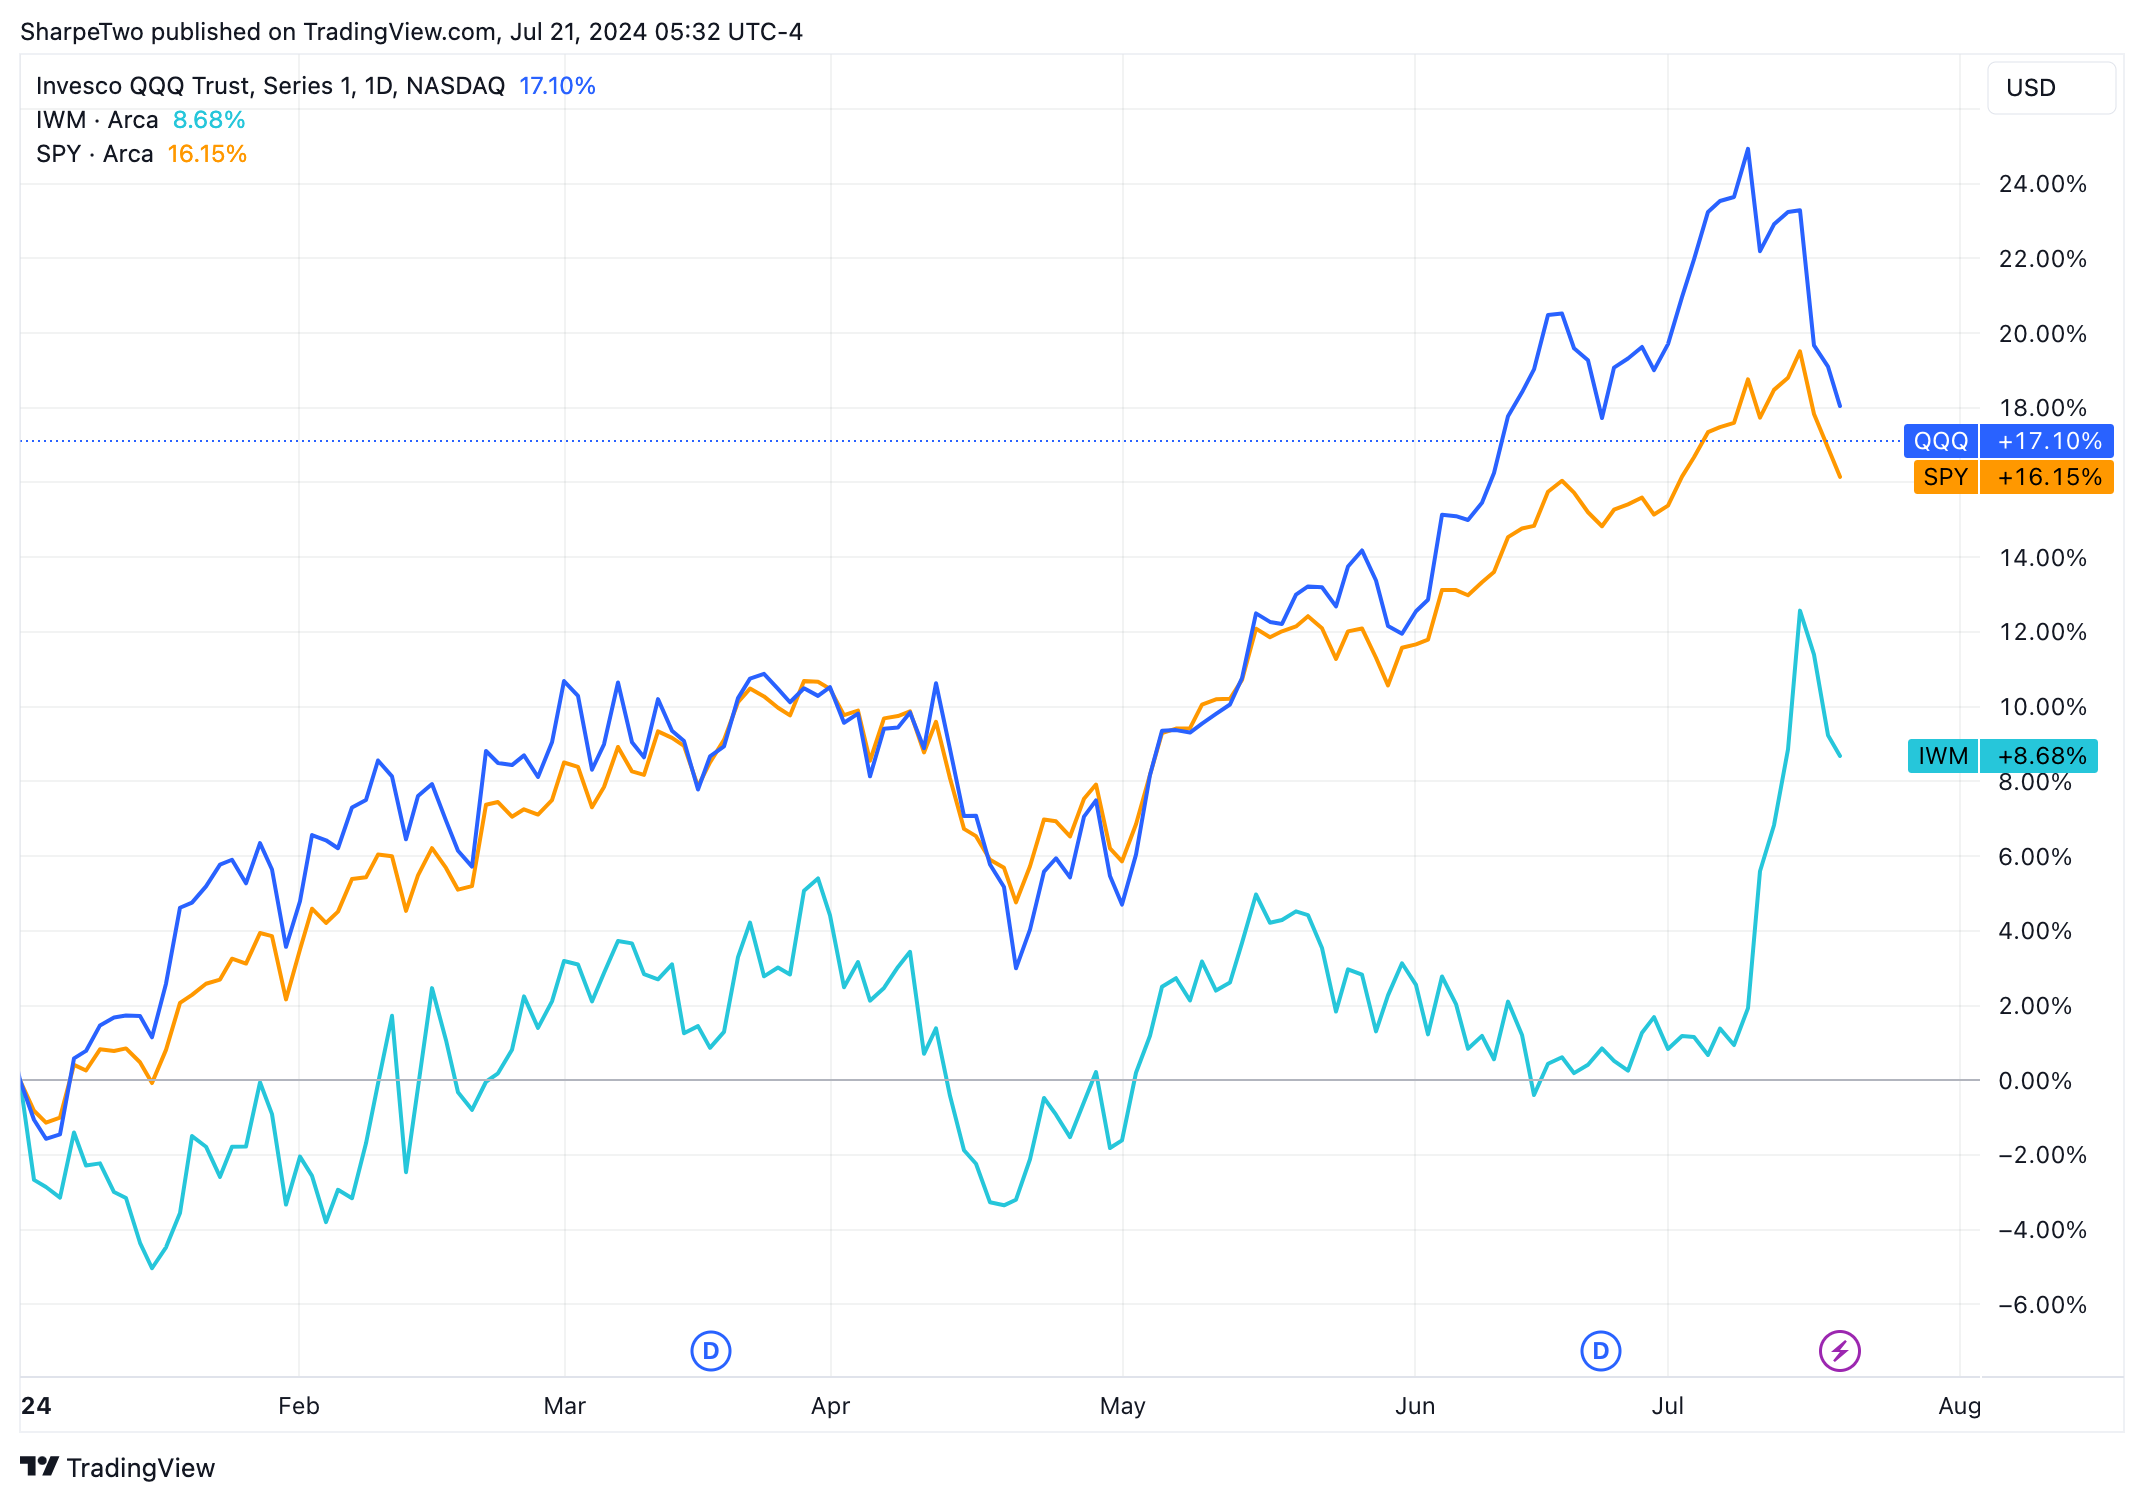
Right now, it feels like fund managers are favoring small and mid-caps over tech and AI, especially after Trump’s recent comments on big tech, particularly semiconductors. Despite taking a leg down like the entire equities sector this week, is there a scenario where IWM closes the gap with the SPY and QQQ?
But let’s focus on their volatility. Remember the craziest week of the year so far when rockets were flying between Iran and Israel? This week's realized volatility levels have finally caught up to those levels in QQQ and IWM. SPY still has a little way to go.
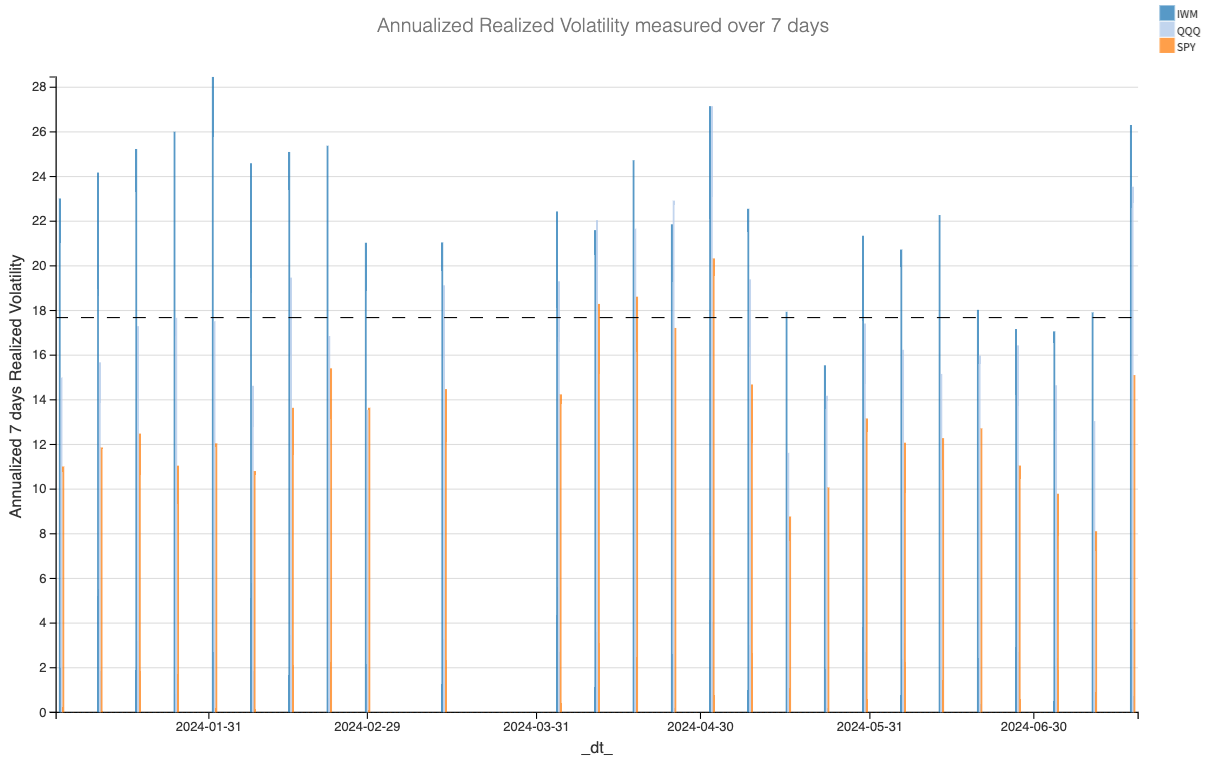
Looking at this chart, a super bullish trader might wonder why we wouldn’t follow a similar trajectory to April and return to no volatility within two weeks.
Volatility tends to cluster, and the calendar has enough key events to keep volatility at its current levels. Next week, in particular, we will have the earnings for Google on Tuesday, and the July FOMC meeting will take place. Not to mention that we are only a month away from Jackson Hole.
With this dense calendar lined up, let’s see what the implied volatility curve in SPY tells us.
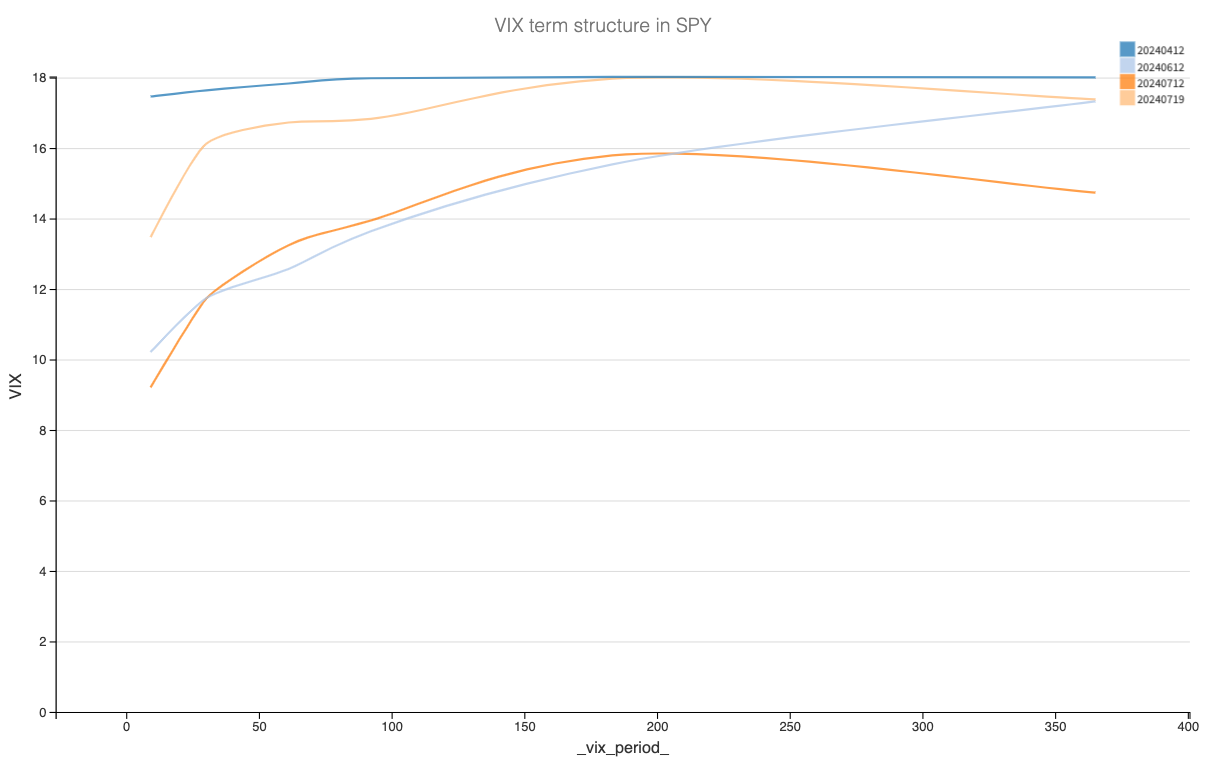
What transpires from this term structure analysis is that not only has the level of volatility gone up, but it is also much flatter than it was about a week ago. It is not as flat as in April, but we have taken a step towards flatness.
This reading aligns with the broader sentiment you can “gauge” from the market: there has been a swift paradigm change due to the uncertainty ahead. However, we are not yet flat and certainly not in backwardation.
We are not saying it cannot happen in the next few weeks, especially if more uncertainties are added to the conversation. However, earnings have been positive so far, the economy is still holding up, and there are still two clearly identified candidates for the US elections.
Yes, this may be difficult to hear, but even with the steepest spike this year, we are still … in a low-volatility regime.
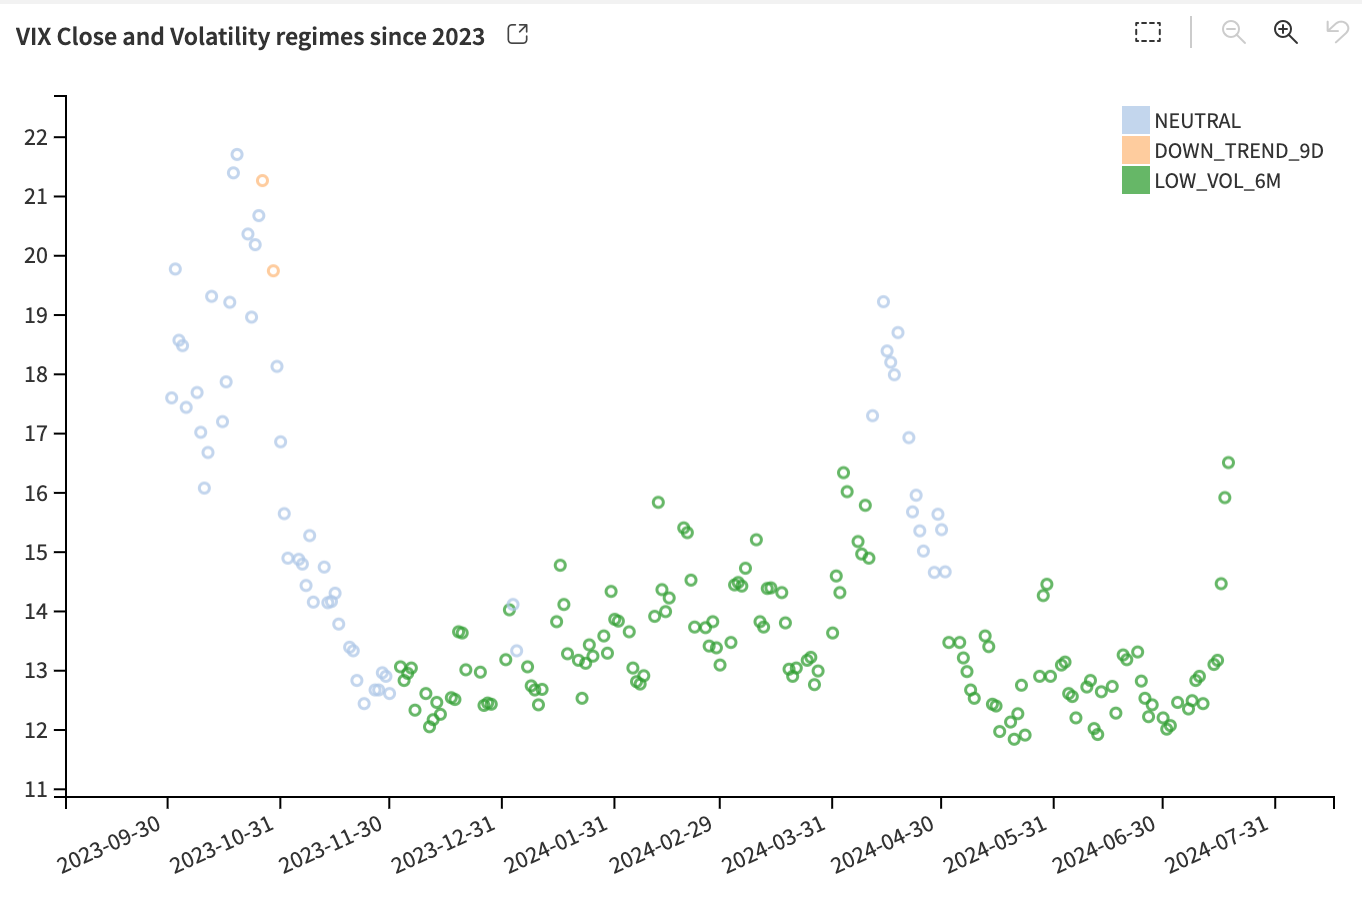
Now, the probability of seeing a blue dot signaling a more neutral regime in the next few weeks is much higher than it was at the beginning of the month. However, before starting to short everything, buying bunkers, and getting ready for World War 3, it may be good to take a step back and look at things for what they are.
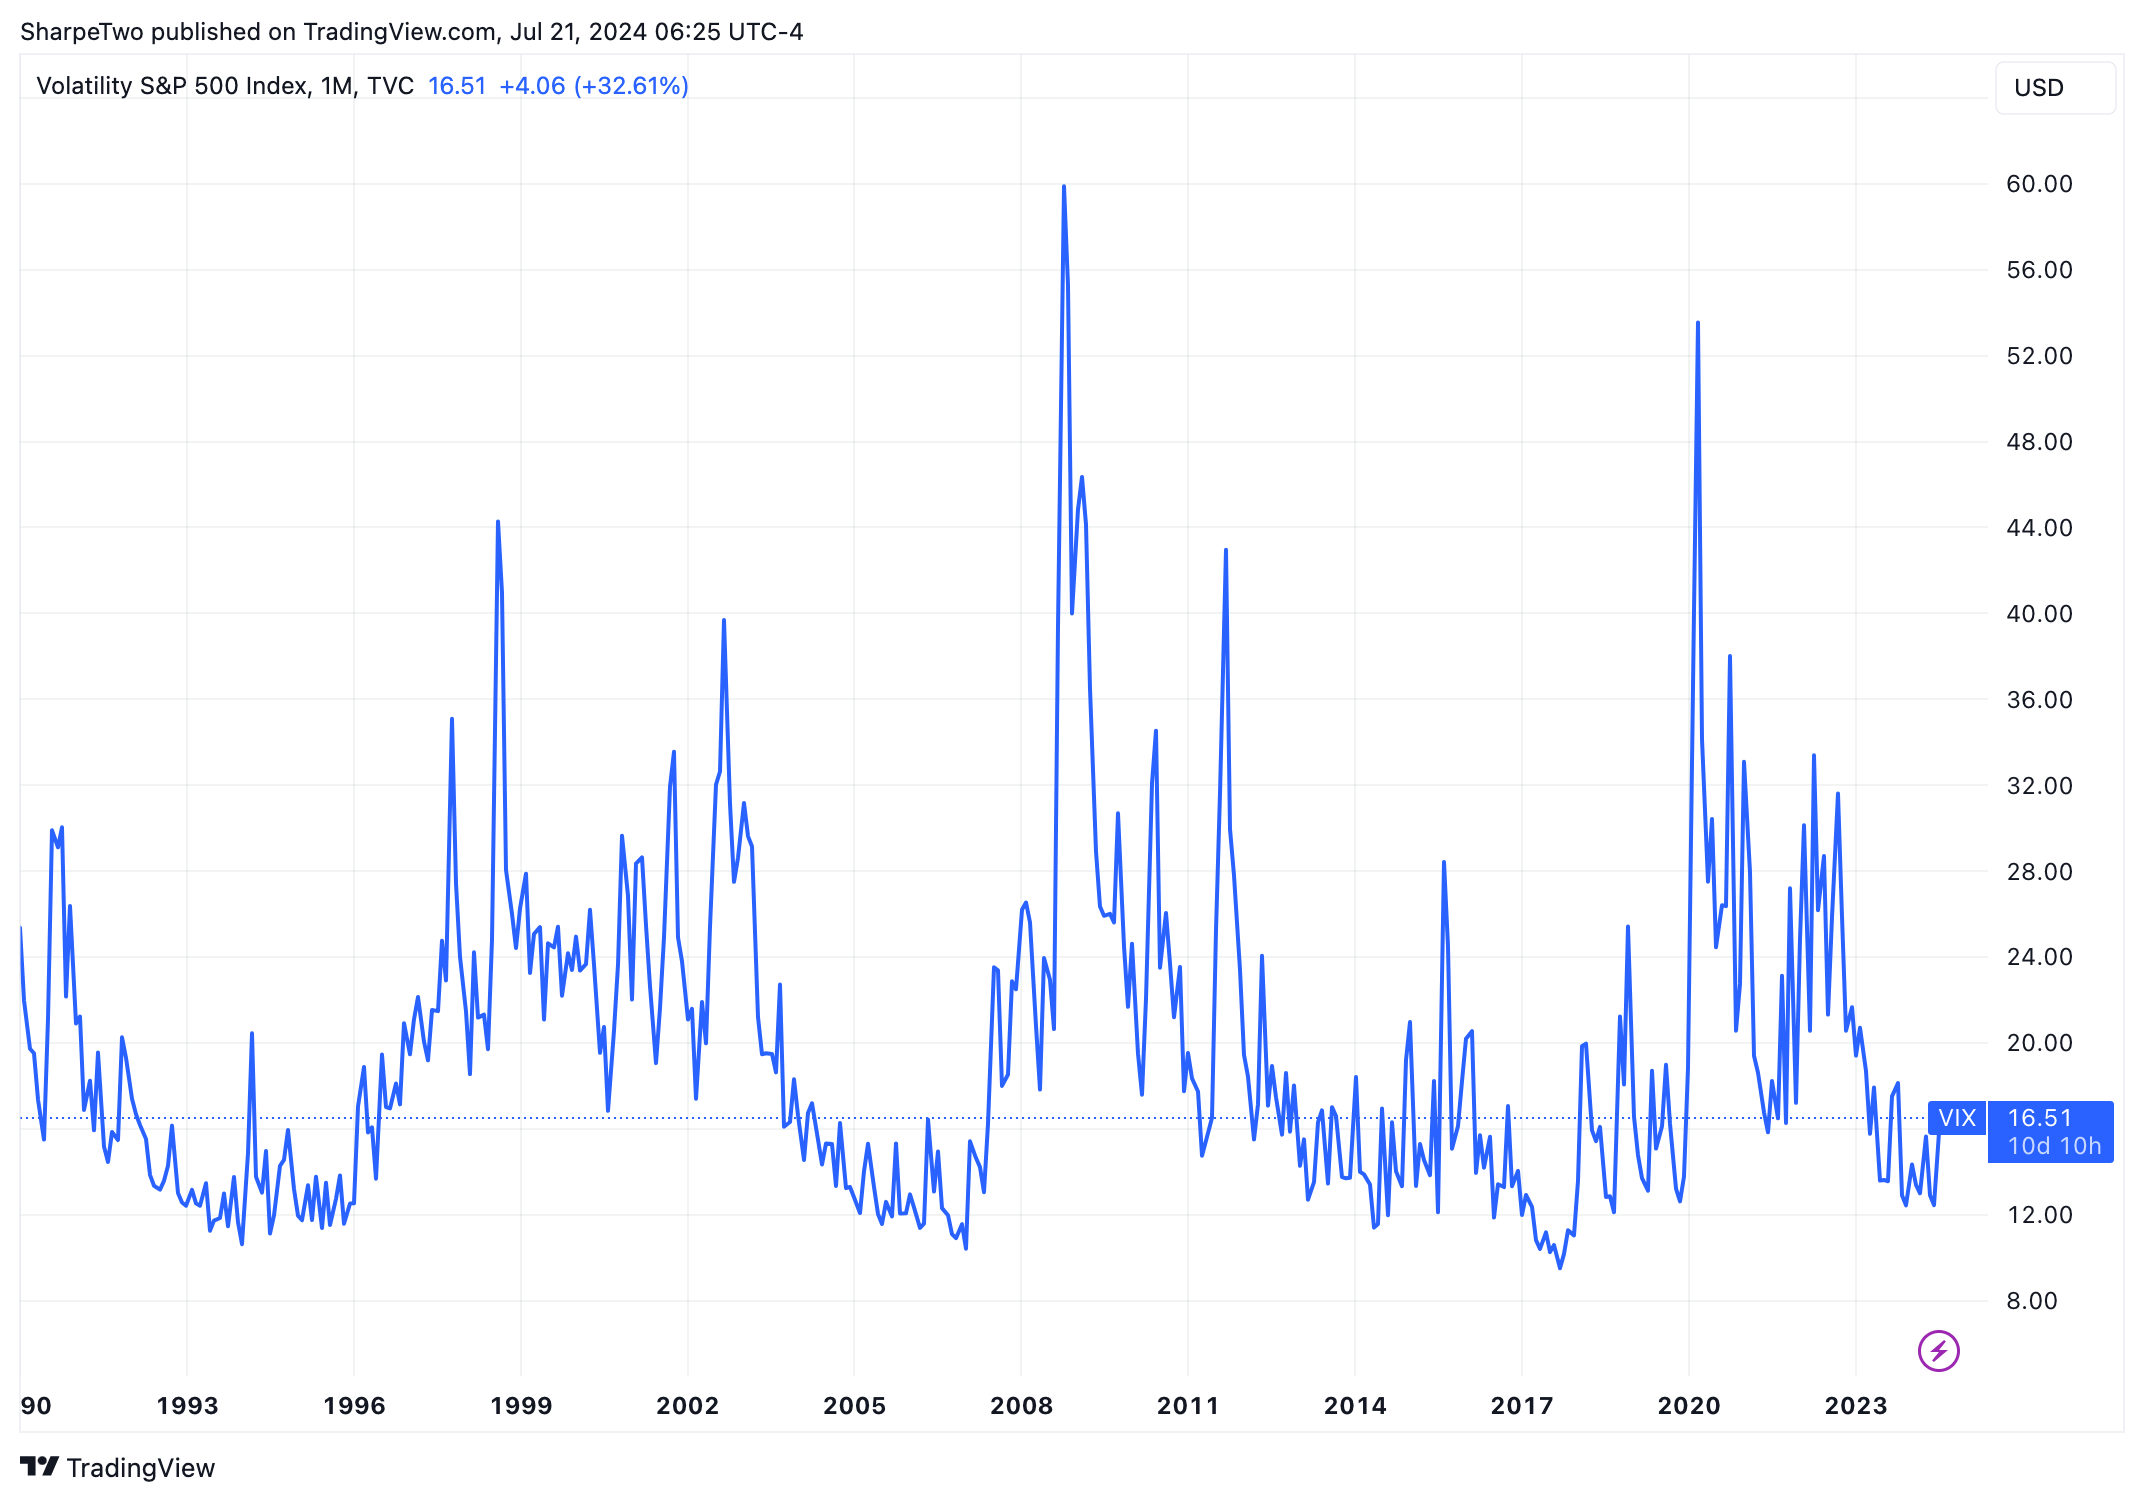
If, looking at this chart, your first inclination is to think there is more than a 90% chance we will hit 30+ by the end of August, you may be trading for the wrong reasons.
Seek help.
Sharpe Two is a reader-supported publication. To receive new posts and support our work, consider becoming a free or paid subscriber.
In other news
Crowdstrike suffered a severe outage on Friday, impacting numerous major international companies, from banks to airlines and even government agencies. Even though Crowdstrike quickly ruled out the possibility of a major hack, the stock still took a hit, losing up to 15% at the worst point of the session. The explanation is that an erroneous update pushed out late last week triggered a domino effect that was felt everywhere. This incident highlights how integrated technology has become in our daily lives and how dependent we are on systems we might not even be aware of for everything to run smoothly.
While this publication focuses on market volatility and hedging risks, the same principles can be applied to many other areas: If something really bad were to happen on the tech side, do you have a mitigation plan?
Thank you for staying with us until the end. As usual, here are a few interesting reads from last week:
- Big tech rotation is on everyone's lips. But what does that mean exactly? What is likely to stay bid, and what is going to crash? There is no one-size-fits-all answer, but here is an excellent summary from .
- If you are a sports fan, this summer has been an absolute dream. But what can we learn from sports' top competitors and legends? Here is an article from , inspired by Roger Federer’s amazing speech at Dartmouth: you can only control the next point... and your edge.
- Speaking of edge, volatility finally spiked, and we saw VVIX above 90. Here is a reminder of a piece of research we published a while ago. Spoiler alert: it worked again this week.
That’s it for us this week. We wish you a wonderful week ahead and happy trading.
Data, charts, and analysis are powered by Thetadata and Dataiku DSS.
Have access to our indicators using our API.
Book a consultancy call to talk about the market with us.
Contact at info@sharpetwo.com.
Disclaimer: The information provided is solely informational and should not be considered financial advice. Before selling straddles, be aware that you risk the total loss of your investment. Our services might not be appropriate for every investor. We strongly recommend consulting with an independent financial advisor if you're uncertain about an investment's suitability.